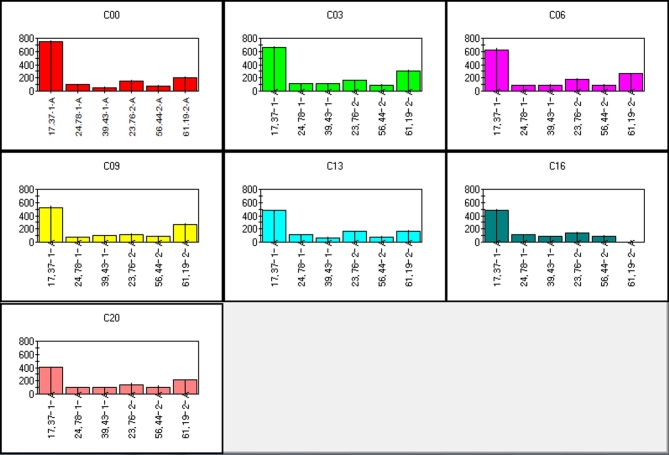
Figure 4.
Mean bar graphs of selected peak areas used as raw data in chemometrics representing key chemical compounds, which are important for discrimination of egg freshness (where C00 = d 0, C03 = d 3, C06 = d 6, C09 = d 9, C13 = d 13, C16 = d 16, and C20 = d 20). Along the x-axis are variables (sensors) and values along the y-axis represent abundance.

