Figure 6.
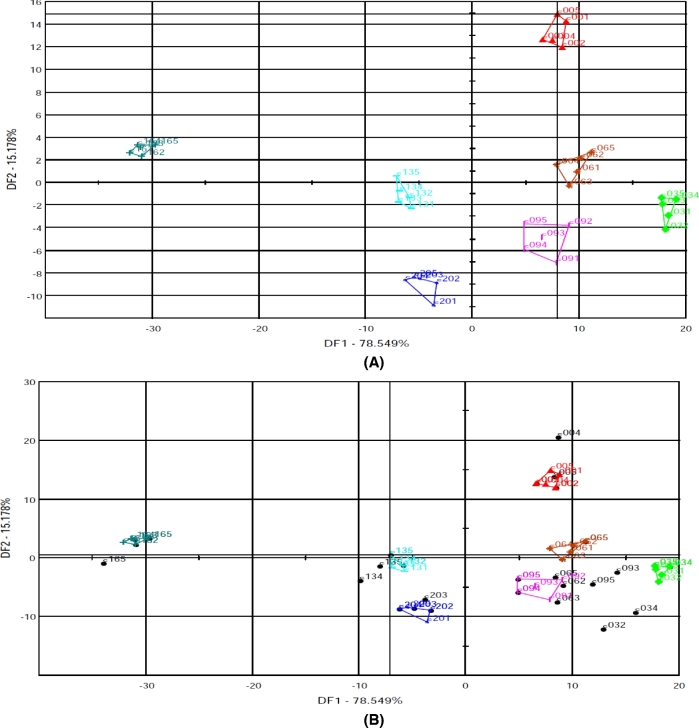
DFA model analysis results based on electronic nose data obtained from egg yolk samples ((A), calibration plot; (B), validation plot) for the discrimination of eggs stored for 0 to 20 d. Individual symbols indicate replicate samples taken at different storage time. C00 = d 0, C03 = d 3, C06 = d 6, C09 = d 9, C13 = d 13, C16 = d 16, and C20 = d 20.

