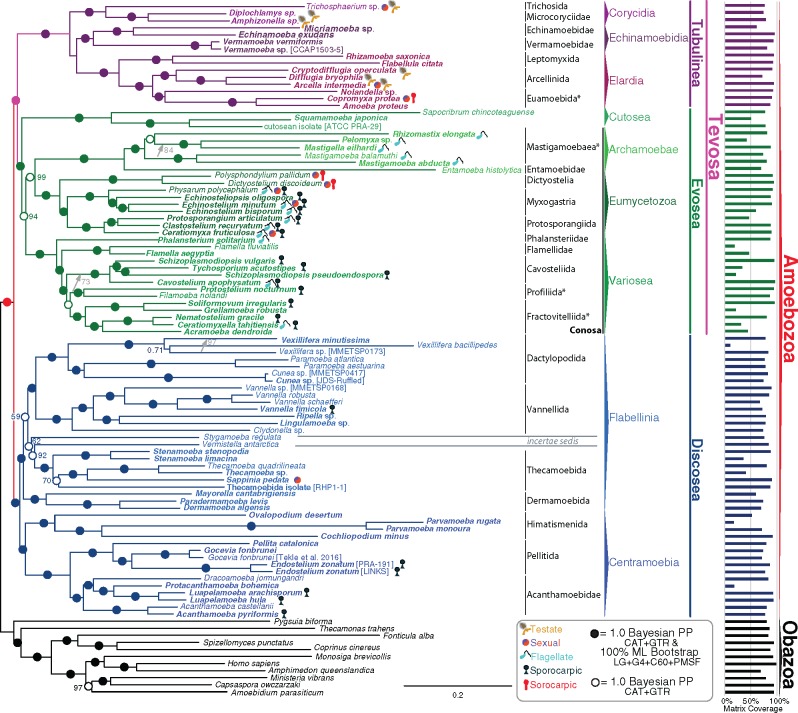
Fig. 3.
The Tree of Amoebozoa. 325 gene (63,157 sites) phylogeny of Amoebozoa rooted with Obazoa. The tree was built using PhyloBayes-MPI v1.6j under the CAT + GTR model of protein evolution, with two converged independent chains, burnin 1,850 generations, with a postburnin sampling of ∼2,800 generations. Values at nodes are posterior probability and ML bootstrap (MLBS) (1,000 ultrafast BS reps, IQ-Tree LG + Γ4 + FMIX(emprical,C60) + PMSF values respectively. Filled in circles at nodes represents full support in both analyses (1.0/100). Open circles represent full Bayesian support without full MLBS support. Colors of dots represent taxa and branches are colored according to their respective taxonomy (i.e., red is corresponding to the deepest branches of Amoebozoa). Nodes not recovered in the corresponding ML analysis are represented by an asterisk and the differences between the Bayesian and ML tree topologies are depicted with gray arrows. The length of the Entamoeba branch has been reduced by 50%. Bars along the right side of the figure show the percent of the total data set available for each taxon. Novel data were generated in this study for taxa whose names are bold.

