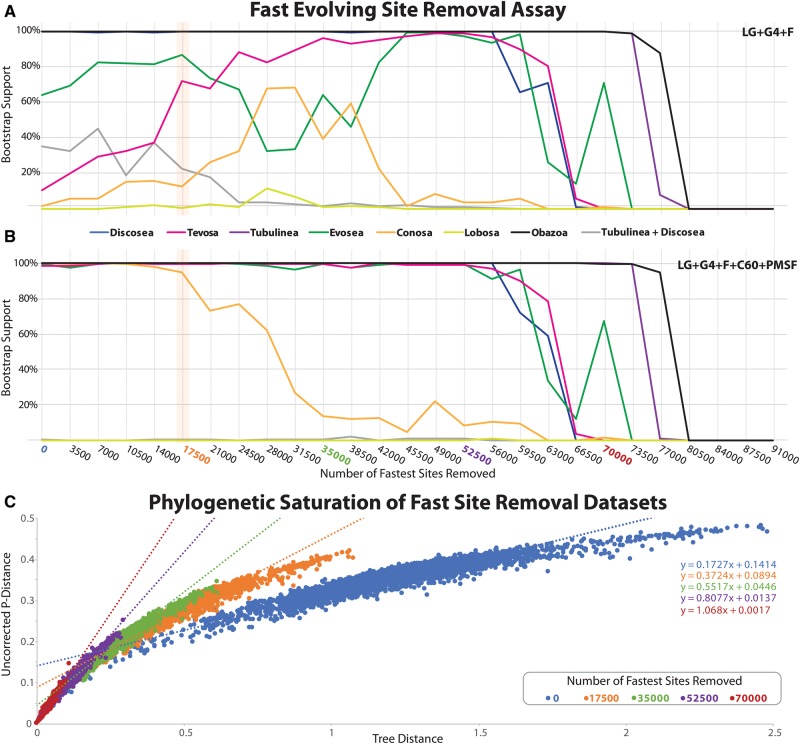
Fig. 4.
Effects of fast evolving sites on our phylogenomic analyses. (A, B) Sites were sorted based on their rates of evolution estimated under LG + Γ4 and removed from the data set from highest to lowest rate. Each step has 3,500 of the fastest evolving sites removed. The bootstrap values for each bipartition of interest are plotted under the LG + Γ4 + F (A) and LG + Γ4 + C60 + F + PMSF (B). The data set with 17,500 sites removed (orange bar) was the basis of the main phylogenomic analyses shown in figure 3. This data set showed the most drastic changes in MLBS values in the LG + Γ4 + F MLBS assay (A). (C) Phylogenetic signal saturation assay of five data sets within the fast site removal assay shown in A. Signal saturation was assessed by plotting uncorrected pairwise distance to the per taxon tip to base tree distance the best scoring ML tree inferred under LG + Γ4 + C60 + F + PMSF. Data sets plotted correspond to the whole data set and a subset of fast site deletion data sets (17,500, 35,000, 52,500, and 70,000 sites removed) shown in A. The linear equation (y = mx + b) for each plot is shown on right of the figure and is color coded to each examined data set. The orange data set (17,500 sites removed) was used for subsequent analyses as it shows limited phylogenetic saturation to phylogenetic signal.

