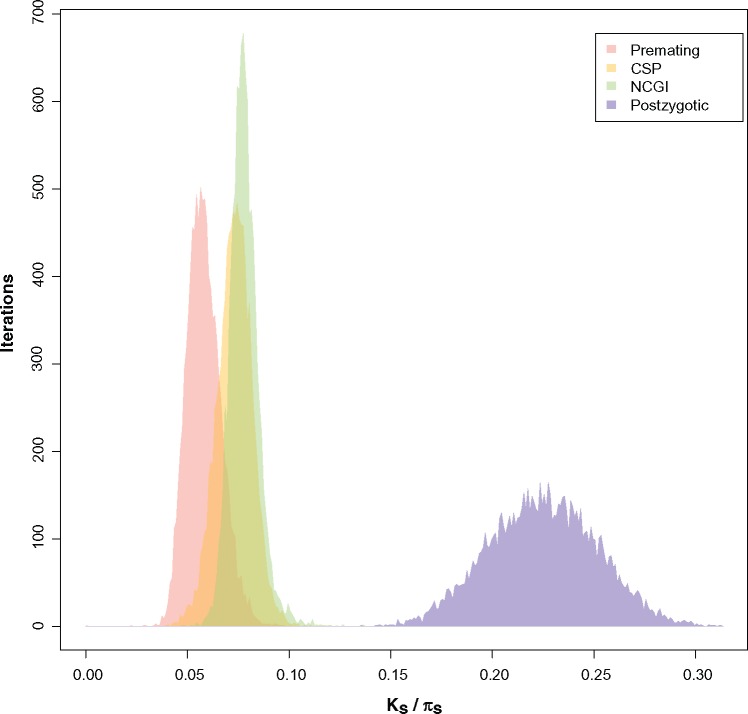
Fig. 2.
Premating, NCGI, CSP, and postzygotic isolation evolve at different rates in the melanogaster species subgroup. Threshold_Ks illustrates the Ks value for which a given RI barrier achieves a value of 0.95. Premating isolation values are red, conspecific sperm precedence (CSP) are yellow, noncompetitive gametic isolation (NCGI) are green, and postzygotic values are blue. Regression coefficients (supplementary table S9, Supplementary Material online) show that the rates at which each RIM increases differ from each other.

