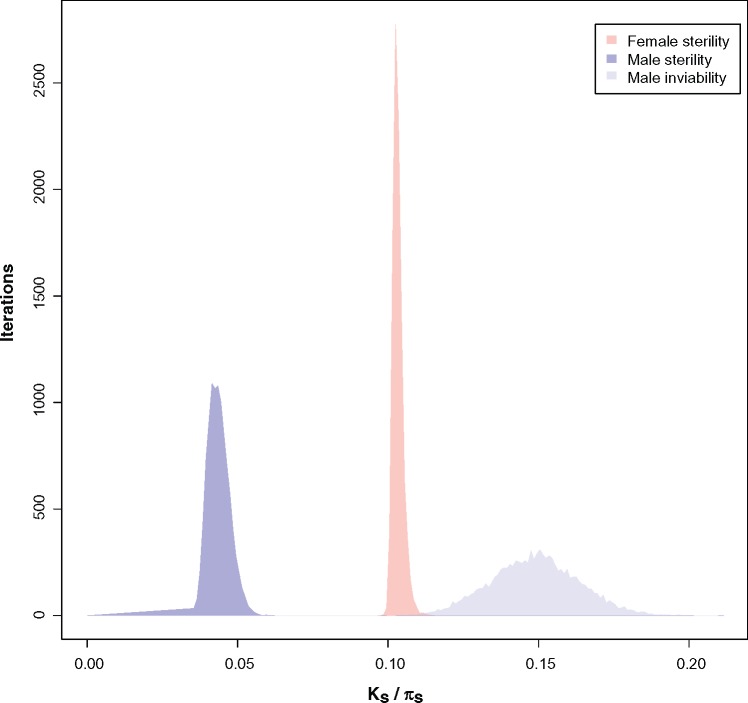
Fig. 5.
Female sterility, male sterility, and female sterility evolve at different rates in the melanogaster species subgroup. Threshold_Ks indicates the Ks value for which a given RI barrier achieves a value of 0.95 (similar to the distributions shown in fig. 2). Even though these distributions of bootstrapped values are not a statistical test, Threshold_Ks illustrates how quickly isolation approaches 1. Female sterility values are red, male sterility are purple, and male inviability are blue. Female viability did not reach (or approached) an asymptote in our study and for that reason there is no distribution of bootstrapped values for this RIM.

