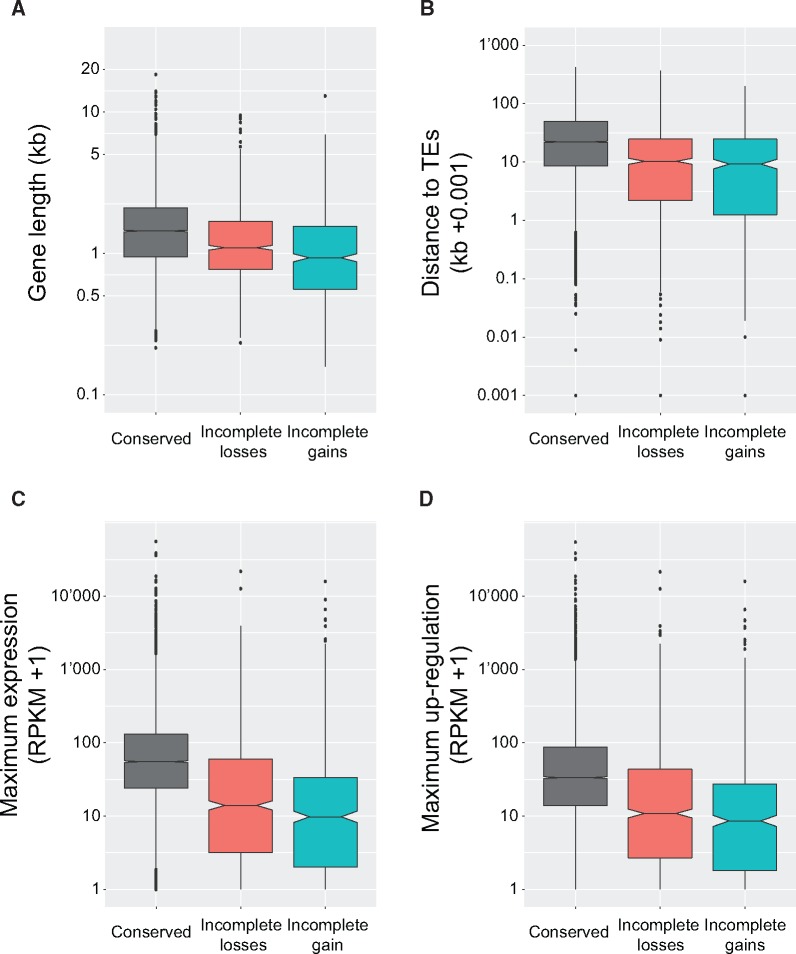
Fig. 2.
Differences in length, genomic location, and expression level of conserved genes, genes affected by an incomplete loss and genes showing an incomplete gain. (A) Gene length (kb). (B) Distance to closest transposable element (TE). (C) Maximum gene expression level during infection of a wheat host. RPKM, reads per kilobase of exon per million mapped reads. (D) Upregulation during wheat infection. Upregulation was assessed as the maximum absolute difference in RPKM values over five time points during infection.

