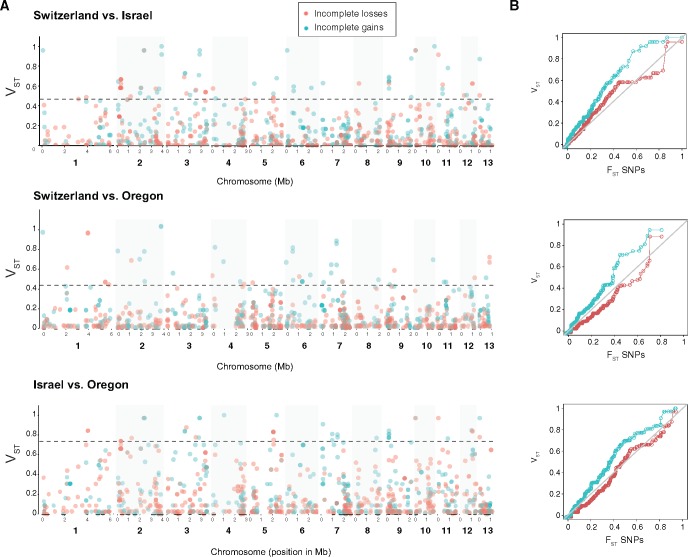
Fig. 6.
Pairwise comparisons of population differentiation of incomplete gene gain and loss frequencies. (A) Distribution of VST values of presence/absence polymorphism at gene gain and loss loci. The dashed line shows the 97.5th percentile of the distribution of corresponding pairwise FST value for genome-wide synonymous SNPs (n = 1,457). (B) Quantile–quantile plots comparing the distribution of VST for incomplete gene gains and losses and the distribution of FST for the genome-wide synonymous SNPs. Points should follow the diagonal line if distribution of FST and VST were equal.

