
Fig. 2.
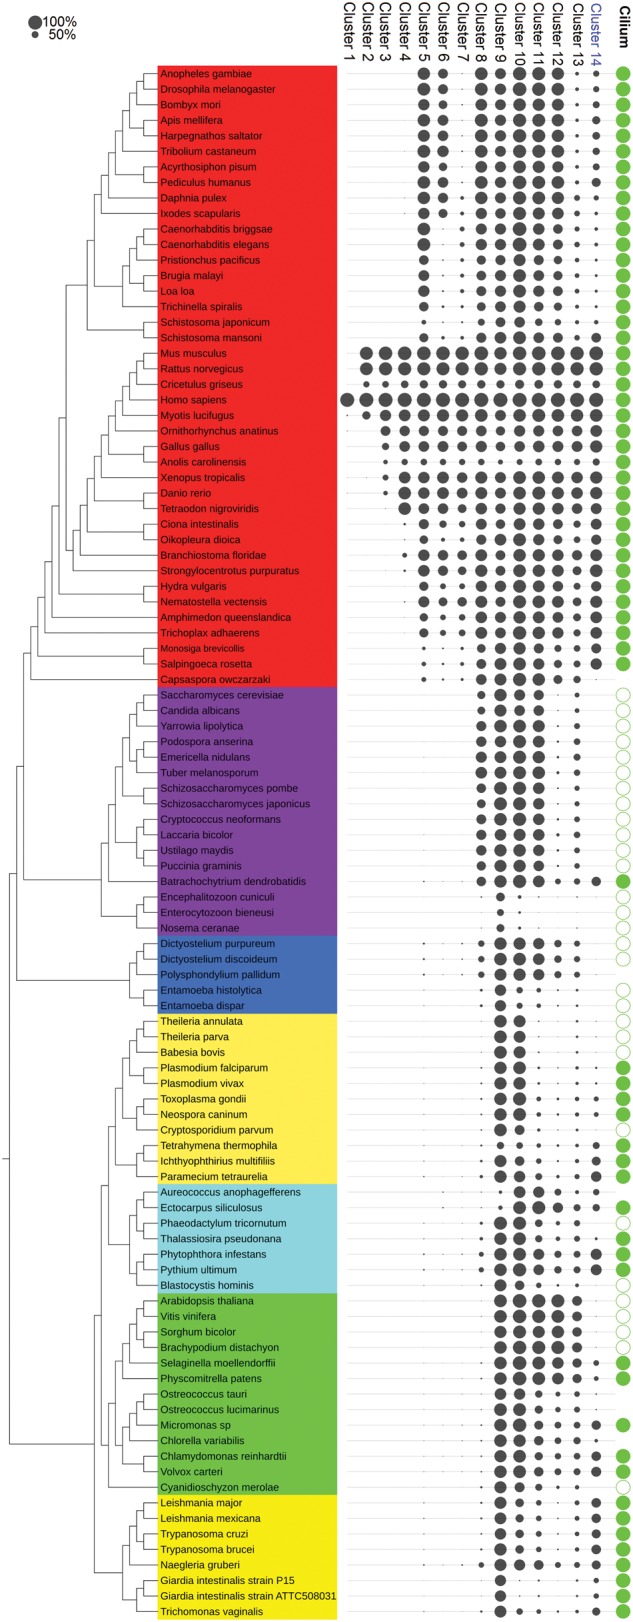
Average phylogenetic profiles of each hierarchical cluster. Species names are colored according to major eukaryotic clades (from bottom to top: Excavata, Plants, Stramenopiles, Alveolata, Amoebozoa, Fungi, Holozoa, i.e., Metazoa, and their closest single-celled relatives). Each column corresponds to a cluster, ranked according to the taxonomical rank to which they correspond starting from human specific (cluster1) to “universal” eukaryotic genes (Cluster 9 and 10). Cluster from 11 to 14 do not correspond to a specific taxonomical division and are ordered by descending size. The circle size is proportional to the percentage of genes from a given cluster with an ortholog found in a given species. The far right column “Cilium” indicates ciliated species (full green circle) and nonciliated species (empty circle). Species for which the existence of a ciliated state was unclear have no circle. Distribution of the Cluster 14 correlates to cilium distribution. This figure was generated using the iTol website (Letunic and Bork 2011).