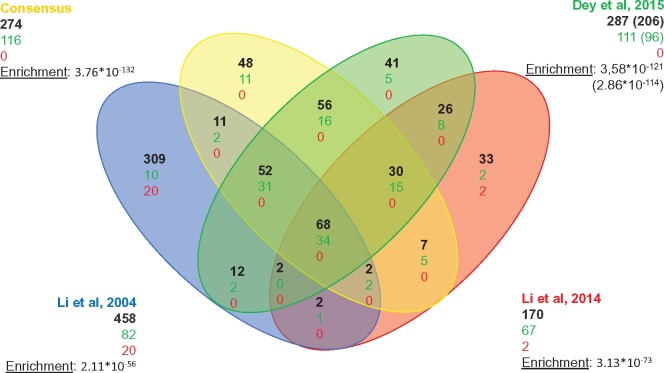
Fig. 4.
Venn diagram of the genes predicted by this work and three previous studies. Number of genes in each subcategory is indicated in black. True positives and false positives are indicated in green and red, respectively. The corresponding enrichment is indicated by the hypergeometric P value. In the original work, genes predicted in Dey et al. (2015) were collapsed in orthology groups, with no distinction between paralogs. The numbers between parentheses correspond to the numbers presented in the original publications: the number of groups of genes predicted. The number of individual genes and true positives present in those groups is indicated with no parentheses and was used to determine overlap.

