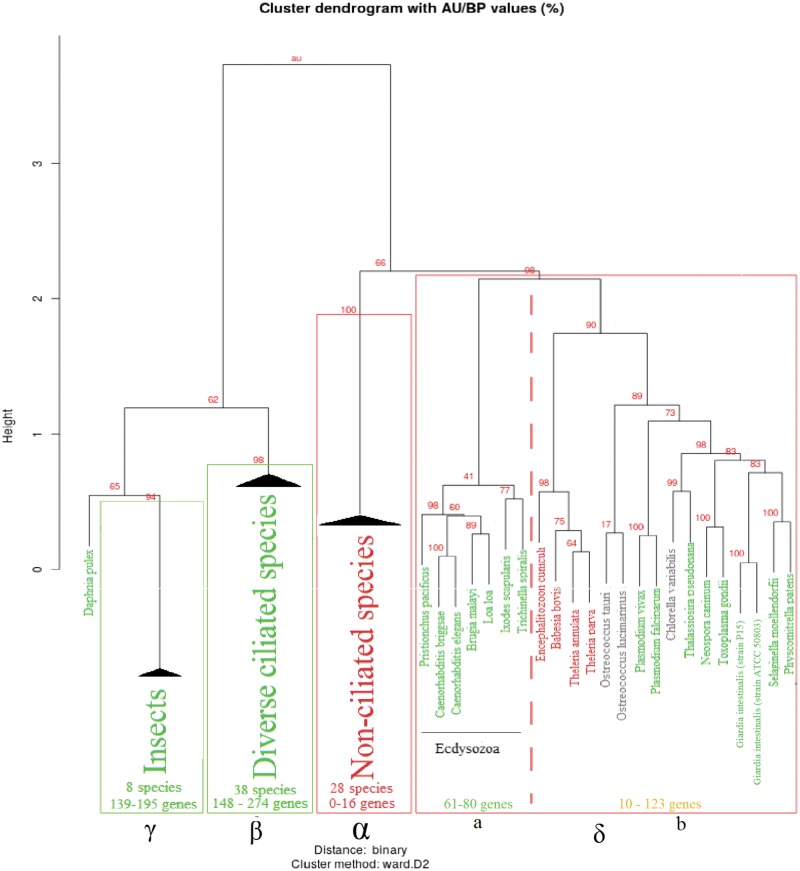
Fig. 5.
Hierarchical clustering dendrogram of ciliary gene profiles in eukaryotic species. Homogeneous clusters are collapsed. The complete dendrogram is available in supplementary material, Supplementary Material online. Approximately Unbiased (AU) P value of each branch is annotated in red. Ciliated species and collapsed clusters with exclusively ciliated species are colored in green, nonciliated species and clusters in red. Species for which the ciliated state is unclear are in black. Significant clusters (AU ≥ 0.90) are framed by a red rectangle and annotated by a greek letter. Collapsed cluster are homogeneous in term of presence of cilia, and are annotated with the number of species they contain, and the minimal and maximal number of orthologs detected in these species. The cluster δ contains both ciliated and nonciliated species. It forks in two subclusters (separated by a dotted line): subcluster a corresponds to nematodes and ticks, representative of Ecdysozoa and subcluster b to a mixed group of eukaryotic species.

