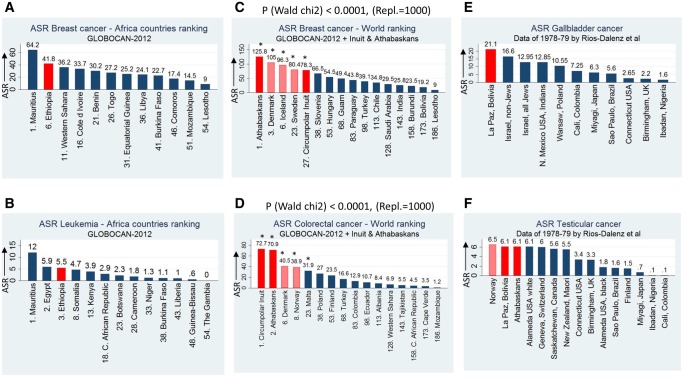
Fig. 1.
Cancer age-standardized (ASR) data by country and by cancer type. ASR data of 184 populations can be found in supplementary table S1, Supplementary Material online. Bars of populations of main interest are in red color. Bars showing noticeable data of other populations are in pink color. For (A), (B), and (C), (D), ASR ranking is indicated by the ranking number before each country/population name. ASR values are according GLOBOCAN-2012 and Young et al. (2016) (2004–2008 ASR data). Bootstrapping for 1,000 random replications in (C) and (D) shows that the association of temperature with ASR is highly significant under a Wald χ2 statistic. Additionally, in (C) and (D), statistical analysis showed that when countries/populations were separated in six quartiles according ASR ranking, the first quartile (31 populations in total, asterisk symbolled, 5 of them are shown) had a significantly lower mean of average annual temperatures when compared with the mean of average annual temperatures of the other five quartiles (P=5.09×10⁻⁸, P=3.01×10⁻⁹, respectively). For (E) and (F), ASR 1978–1979 data were taken from Rios-Dalenz et al. (1981). In (F), Athabascans’ ASR of testicular cancer is included in the plot according Young et al. (2016), since data show that ASR values are stable long-term (1989–2008). ASR is termed as “new cases/time period/100,000 individuals.”

