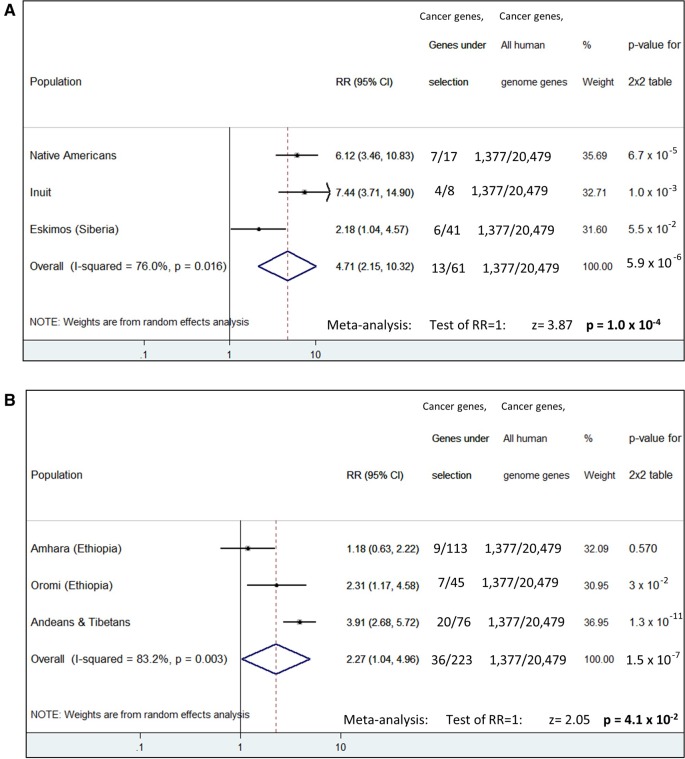
Fig. 3.
Forest plot showing statistical analysis for enrichment of genes under selection with cancer associated genes. Results are presented for each population separately, for an overall analysis and for a meta-analysis. (A) COLD populations and (B) ALTITUDE populations. Analysis was based on list comparisons that are included in supplementary table S2, Supplementary Material online. The highest significances are observed for Native Americans, Tibetans-Andeans, and for overall COLD. RR, risk ratio.

