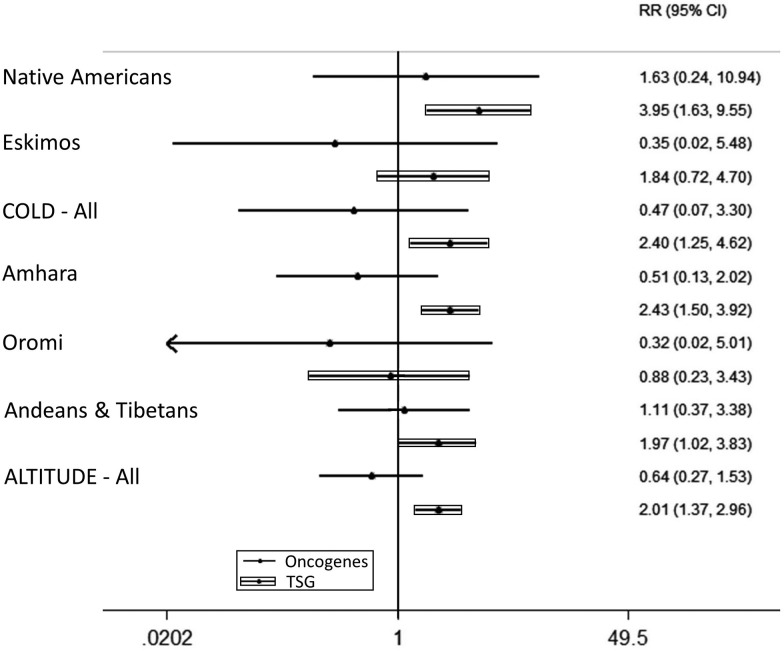
Fig. 4.
Forest plot showing content of genes under selection with oncogenes and tumor suppressor genes (TSG). It is obvious that in all populations there is a positive trend over TSG in comparison with oncogenes (Inuit were not included on this plot since zero genes were found in both gene categories). RR, risk ratio.

