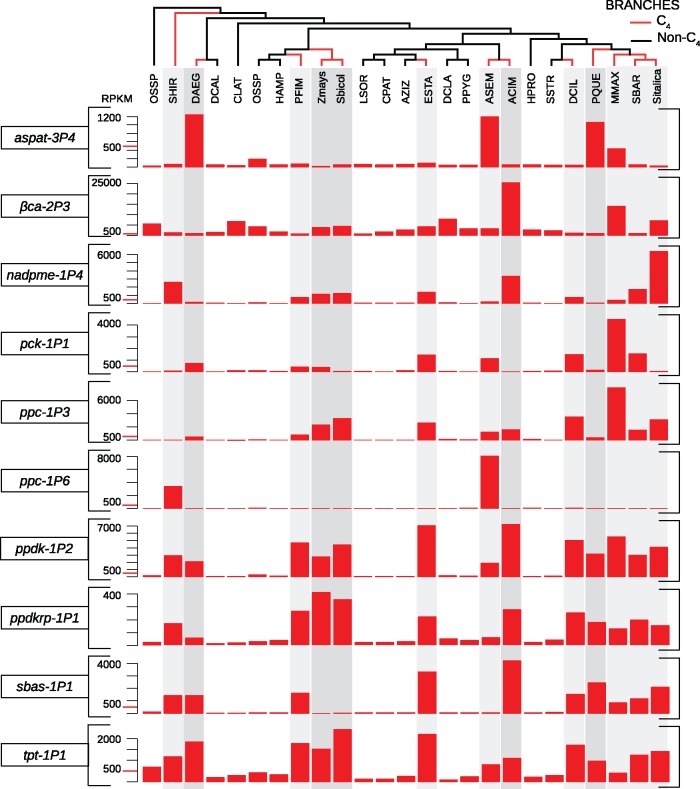
Fig. 2.
Transcript abundances of the main C4 genes in C4 and non-C4 species. Barplots indicate rpkm values (reads per kilobase per million of reads). Phylogenetic relationships among species are indicated at the top, and C4 lineages are numbered as in figure 1, with branches colored in red. Species names are abbreviated as in supplementary tables S1 and S2, Supplementary Material online.

