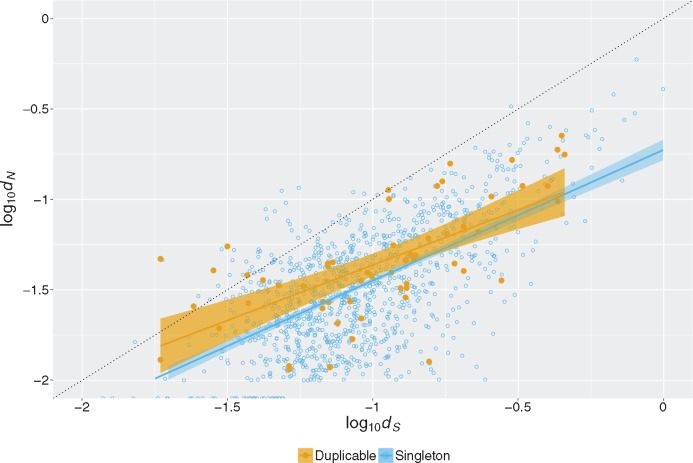
Fig. 3.
Greater difference between dN and dS at higher dS for both duplicable and singleton genes. An xy-scatterplot of versus values for duplicable and singleton genes. The black dotted line indicates dN = dS (neutral evolution). An ANOVA comparing two models with/without duplication status incorporated as an interaction term implies duplication status does not significantly affect the observed trend (F = 1.0876, P value = 0.34).

