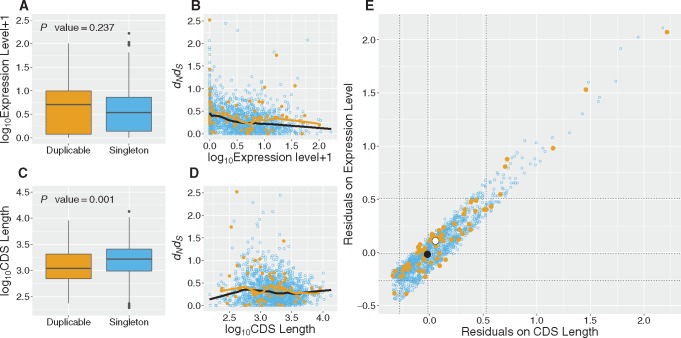
Fig. 4.
Rate differences between singleton and duplicable genes are explained by CDS length and expression level differences. Analysis of 1,473 singletons (blue) and 70 duplicable genes (orange). Boxplot of (a) log10 of expression levels + 1 (log2-transformed RPKM gene expression data) and (c) log10 of CDS lengths of duplicable and singleton genes. P values for the test of difference between the means is shown above the boxplots (P values 0.237 and 0.001, respectively, MWU). LOWESS regression fitted for on the log10 of (b) expression levels + 1 and (d) CDS length. The regression lines for singletons are shown in black and, for duplicates in orange. (e) residual space is graphed by plotting the residuals extracted from the two LOWESS regressions. The median residual value of the duplicable set is indicated by a large white point and the singleton set by a large black point. The dotted lines from each axis indicate the medians and 95 limits for the respective sets of residuals.

