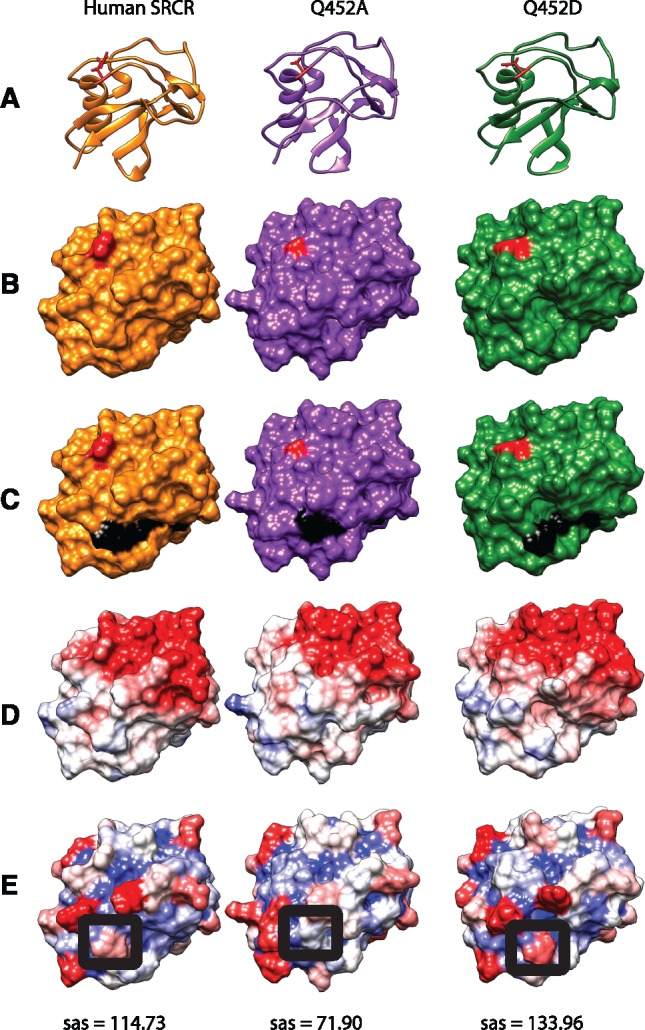
Fig. 3.

Structural comparisons of wildtype human SRCR, Q452A, and Q452D SRCR domain models. (A) Ribbon diagrams of the respective SRCR variants with residue 452 highlighted in red. (B) Molecular surface model of the respective SRCR variants with residue 452 highlighted in red. (C) Molecular surface model highlighting the RGRAEVYY motif in black and residue 452 in red. (D) Coulombic surface charge modeling applied. Red = −10, white = 0, blue = +10 in kcal/(mol·e) at 298 K. (E) Solvent Accessible Surface area (sas) modeling applied. Red = 160 Å, white = 80 Å, blue = 0 Å. Raw sas values of arginine 13, of the SRCR domain RGRAEVYY, circled in black, are shown below each model in Å2.
