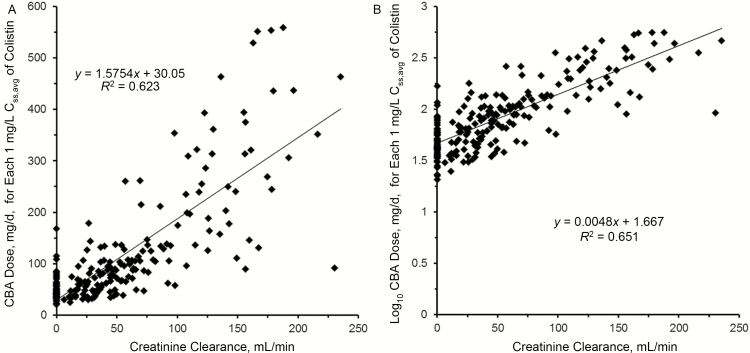
Figure 2.
Linear-linear (A) and log-linear (B) plots of the relationship between the daily dose of colistin base activity (CBA) needed for each 1 mg/L of the average steady-state plasma concentration of colistin (Css,avg) and creatinine clearance. The regression equation in panel B with the intercept adjusted from 1.667 to 1.825 is the renally based dosing algorithm (Equation 2 in Table 2).

