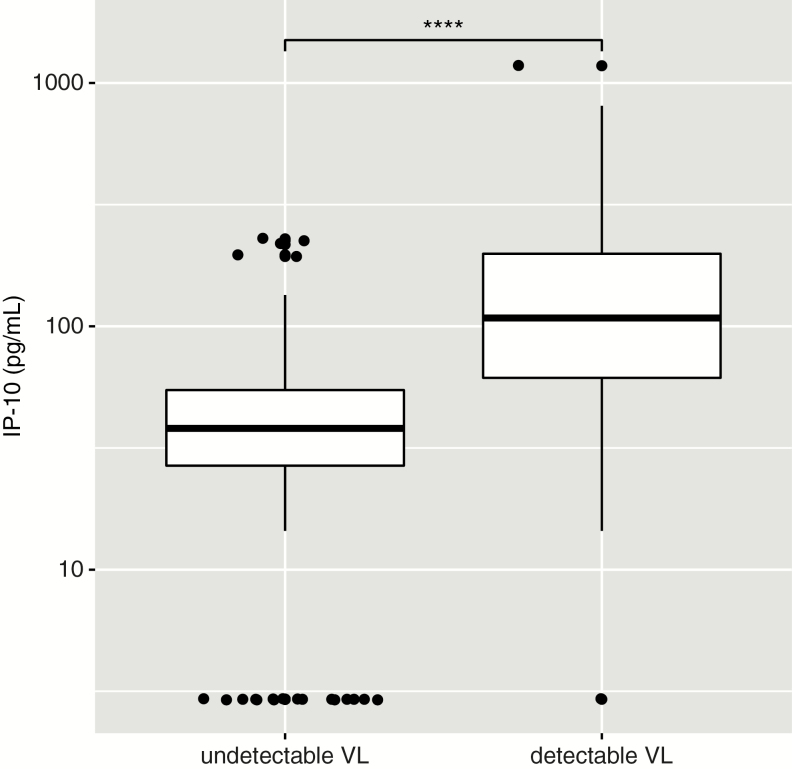
Figure 1.
Comparison of interferon-γ–inducible protein 10 (IP-10) levels in antiretroviral therapy–treated individuals with and without detectable viral load (VL >150 copies/mL). Box as interquartile range (IQR), middle line as median, whiskers as Tukey values (1.5 × IQR) and dots as outliers. Nonparametric U test significance is indicated as “****” for P < .0001.

