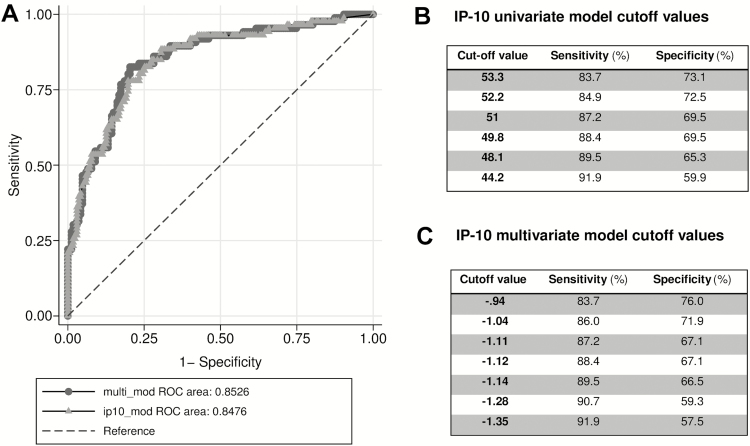
Figure 2.
Performance of univariate and multivariate interferon-γ–inducible protein 10 (IP-10) models in predicting detectable viral load. A, Comparison between receiver operating characteristic (ROC) curves for univariate IP-10 model (line with circles) and multivariate model (line with triangles) including IP-10 and CD4 T-cell count. IP-10 univariate model cutoff points (pg/mL) (B) and multivariate model score cutoff points (C) with their respective sensitivity and specificity values.

