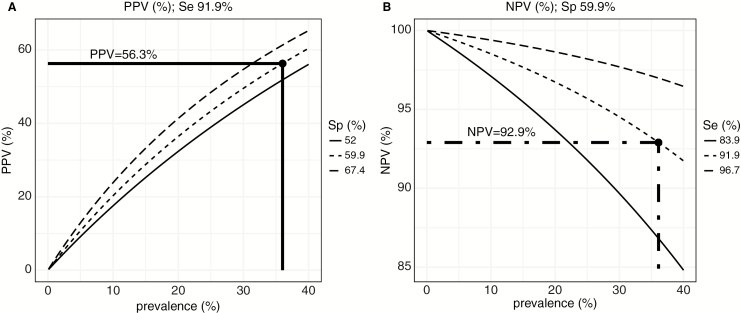
Figure 3.
Accuracy of the interferon-γ–inducible protein 10 model for identifying patients with detectable viral load according to the observed prevalence of individuals on antiretroviral therapy with detectable viremia. A, Positive predictive value (PPV) estimated for sensitivity (Se) = 91.9% and 3 different specificity (Sp) scenarios according to the estimated confidence interval (Sp = 59.9% [95% confidence interval, 52.0%–67.4%]). B, Negative predictive value (NPV) estimated for specificity = 59.9% and 3 different sensitivity scenarios according to the estimated confidence interval (Se = 91.9% [95% CI, 83.9%–96.7%]). Dashed/dotted line indicates PPV and NPV at the prevalence of detectable VL observed in the cross-sectional resistance study [16].

