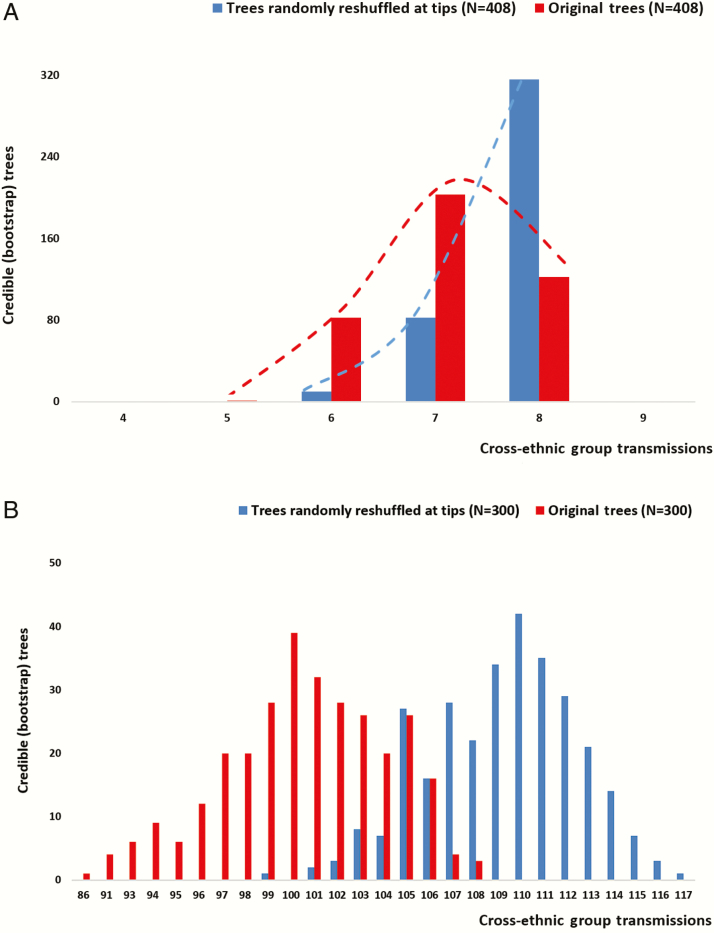
Figure 3.
Distribution of viral migration events corresponding to transmissions between migrants and Greeks (cross-nationality group transmissions) estimated for trees randomly reshuffled at tips (shown in blue) and the original bootstrap trees (shown in red). Distributions were estimated for: (A) subtype A and (B) CRF14_BG.

