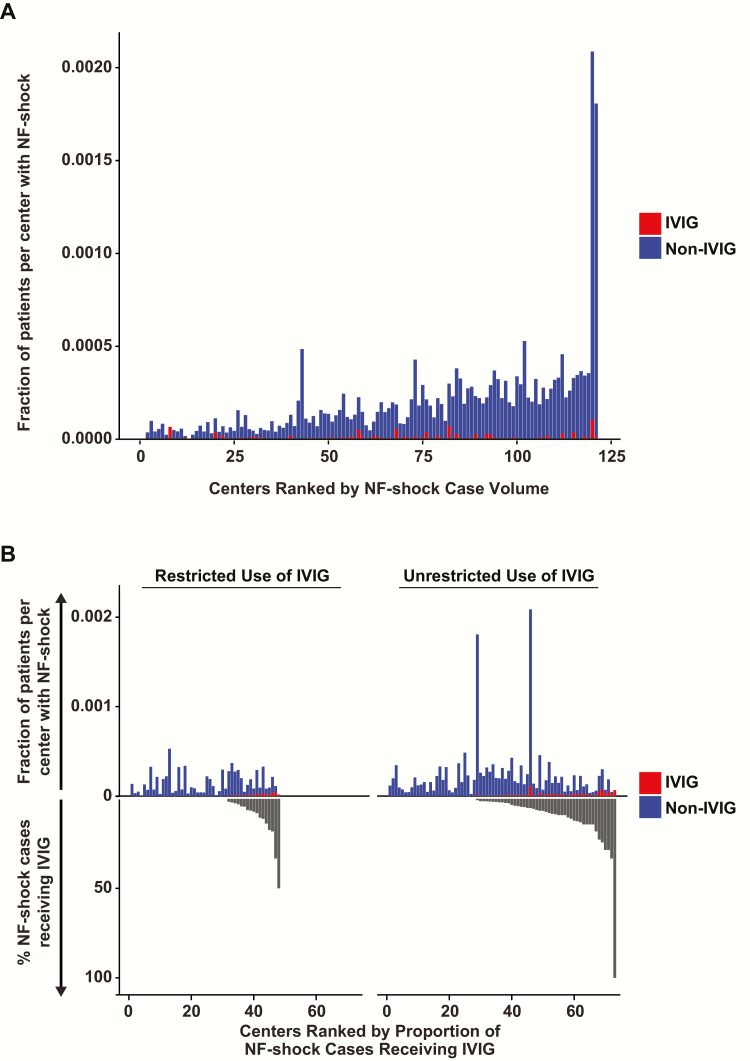
Figure 2.
Variation in volume of necrotizing fasciitis (NF) shock cases, proportion of admissions classified as NF-shock, and distributions of intravenous immunoglobulin (IVIG) use and associated dispensing restrictions across the US academic medical centers and affiliates in the Vizient Clinical Database/Resource Manager. A, Centers with at least 1 NF-shock case between October 2010 and June 2014 are ranked in ascending order of total case volume. Non-IVIG and IVIG cases are shown in blue and red, respectively. B, NF-shock cases are dichotomized based on whether IVIG dispensing is restricted at the treating center. The dispensing policy for IVIG was classified as restricted if prior approval was required from infectious diseases or pharmacy. The positive y-axis depicts NF-shock case density (non IVIG cases shown in blue; IVIG cases shown in red) for each hospital, ordered by increasing proportion of IVIG use in NF-shock, which is represented by the negative y-axis (black). Test of IVIG proportion medians between restricted and unrestricted centers by the Wilcoxon rank-sum test with continuity correction yielded a P value of .015, suggesting that restriction significantly reduced IVIG use for this indication.

