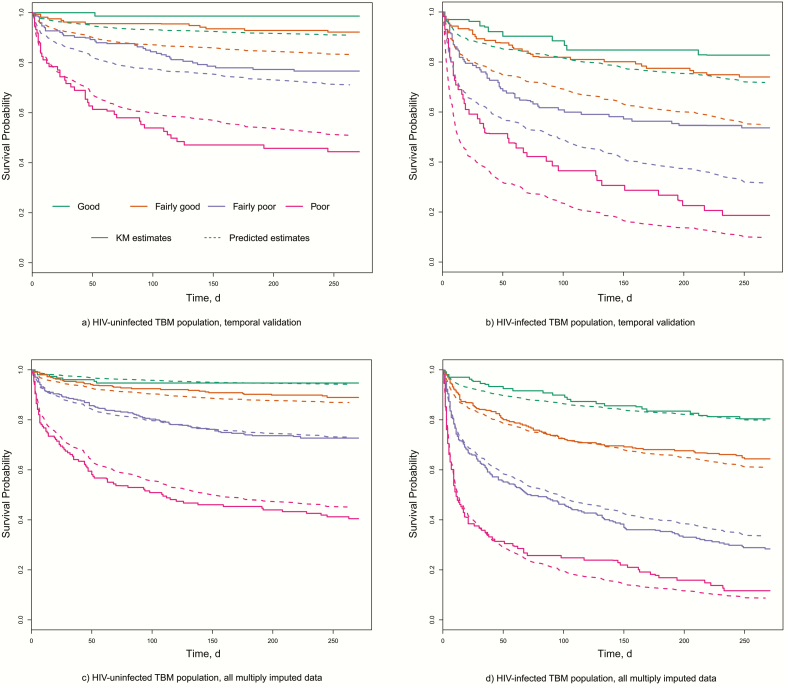
Figure 2.
Comparison between predicted survival with the final models and observed Kaplan-Meier estimates. Risk groups are defined using cutoff points at the 16th, 50th, and 84th percentiles of the prognostic index as generated by the final models (defining “good,” “fairly good,” “fairly poor,” and “poor” prognostic subgroups). (A) HIV-uninfected TBM population, temporal validation; (B) HIV-infected TBM population, temporal validation; (C) HIV-uninfected TBM population, all multiply imputed data; (D) HIV-infected TBM population, all multiply imputed data. Abbreviations: HIV, human immunodeficiency virus; KM, Kaplan-Meier; TBM, tuberculous meningitis.

