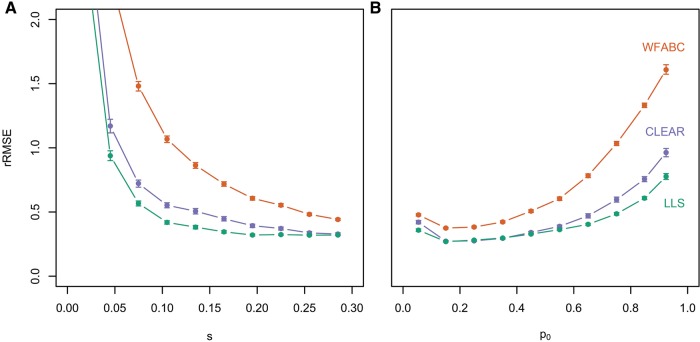
Fig. 2.
Comparison of LLS, WFABC, and CLEAR. Allele frequency tajectories were simulated for 100,000 unlinked loci over 60 generations assuming Ne = 300 with p0 ∈ [0, 1] and s ∈ [0, 0.3]. Selection coefficients were estimated with LLS (green), as well as WFABC (orange), and CLEAR (purple). The relative deviation between estimated and true selection coefficient is shown as a function of s (A) and p0(B).

