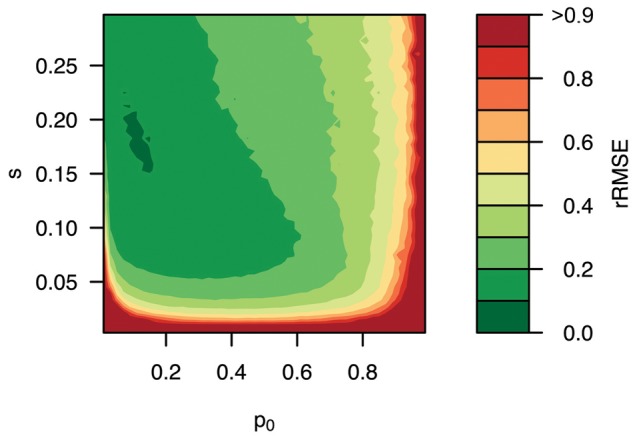
Fig. 5.

Accuracy of selection coefficient estimates under a state-of-the-art E&R experiment. Allele frequency trajectories were simulated in six replicates for ten million unlinked loci over 60 geneations assuming Ne = 300 with p0 ∈ [0, 1] and s ∈ [0, 0.3]. Selection coefficients were estimated with LLS. Estimates were divided into 2,500 bins based on p0 and s, before computing the rRMSE for each bin. Illustrated are the color-coded rRMSE values for each region of the parameter space, with green and red corresponding to high and low accuracy, respectively.
