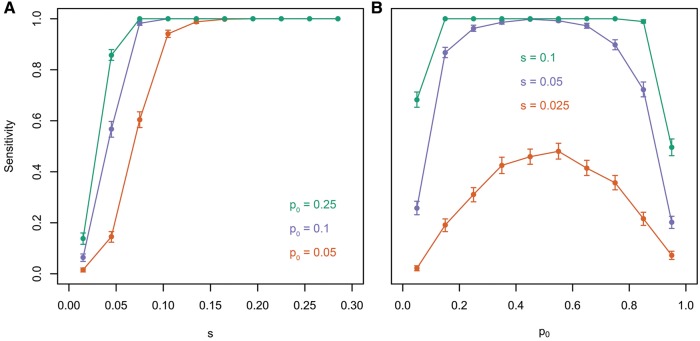
Fig. 6.
Sensitivity to identify selected loci. Allele frequency trajectories were simulated in six replicates for 10,000 unlinked loci over 60 geneations assuming Ne = 300 varying both p0 and s. Selection coefficients were estimated and the null hypothesis of random drift was tested with LLS. Illustrated is the sensitivity in identifying selected loci (α = 0.01) as a function of s and p0. (A) Beneficial variants started at 5% (orange), 10% (purple) or 25% (green) with s ∈ [0, 0.3]. (B) The selection advantage was equal to 0.025 (orange), 0.05 (purple), or 0.1 (green) with p0 ∈ [0, 1].

