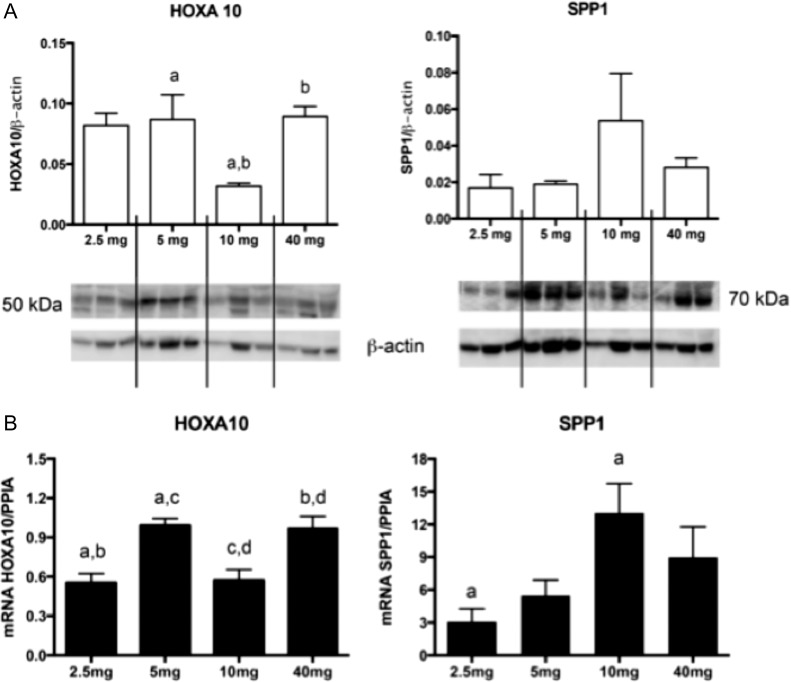
Figure 5.
HOXA10 and ostepontin (SPP1) expression at different doses of progesterone using western blot (A) and mRNA (B). Western blot analysis of three samples in each group was normalized with beta-actin. HOXA10 demonstrates multiphasic protein expression by dose in the comparison among groups, P = 0.04 (a and b); SPP1 has higher mean expression at the 10 mg dose. (B) mRNA expression in different groups—(n = 4 in 2.5 and 5 mg group; n = 5 in 10 and 40 mg group). HOXA10 has multiphasic expression at different doses of progesterone; P = 0.03 (a); 0.02 (b); 0.02 (c); 0.01 (d). SPP1 has a higher expression at 10 mg, compared to 2.5 mg (P = 0.04) Bars represent mean (SEM) and significance among groups was identified by ANOVA with Tukey's post hoc test.

