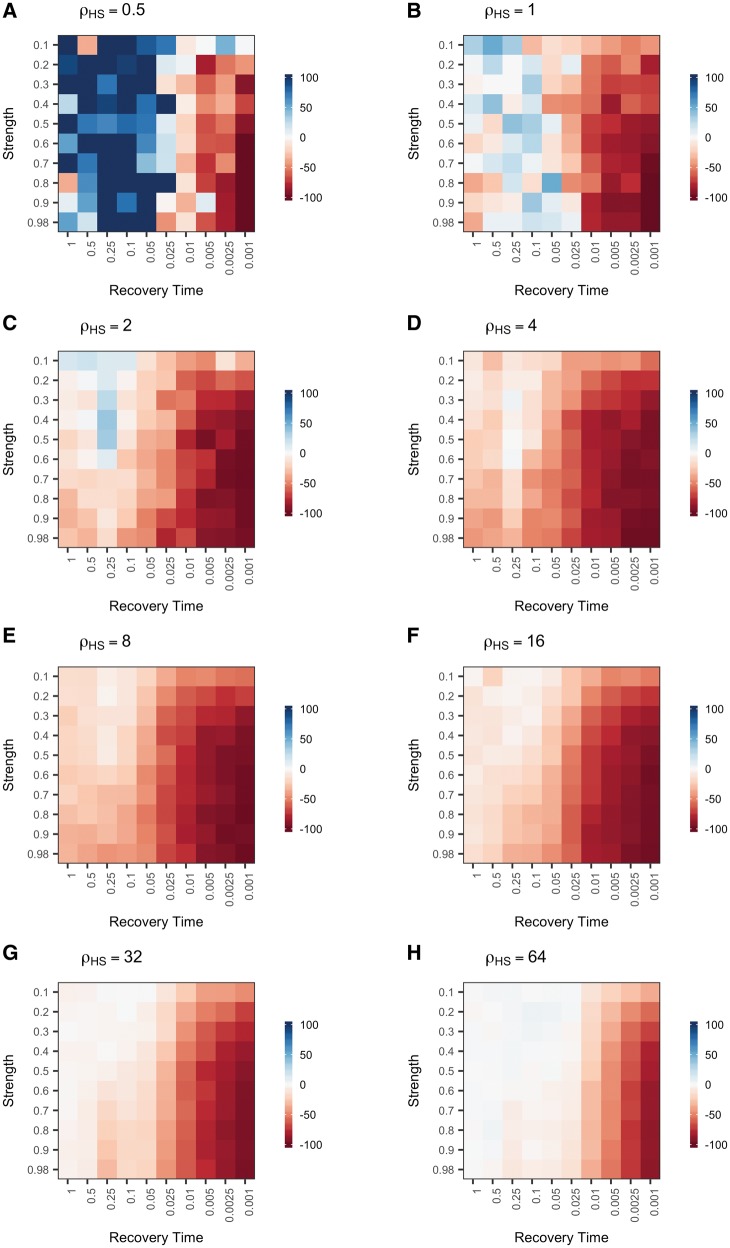
Fig. 1.
Population bottlenecks decrease power to detect recombination hotspots. Each square in the plot represents the percent difference in power to detect a hotspot for a population with a bottleneck of a given strength (y-axis) and recovery time (x-axis) relative to a control equilibrium population of the same size (N0 = 10,000). Power was calculated as the percent of measurable simulations for each condition in which the true recombination hotspot was significantly identified by LDhot. Panels display power for hotspots with different intensities (.

