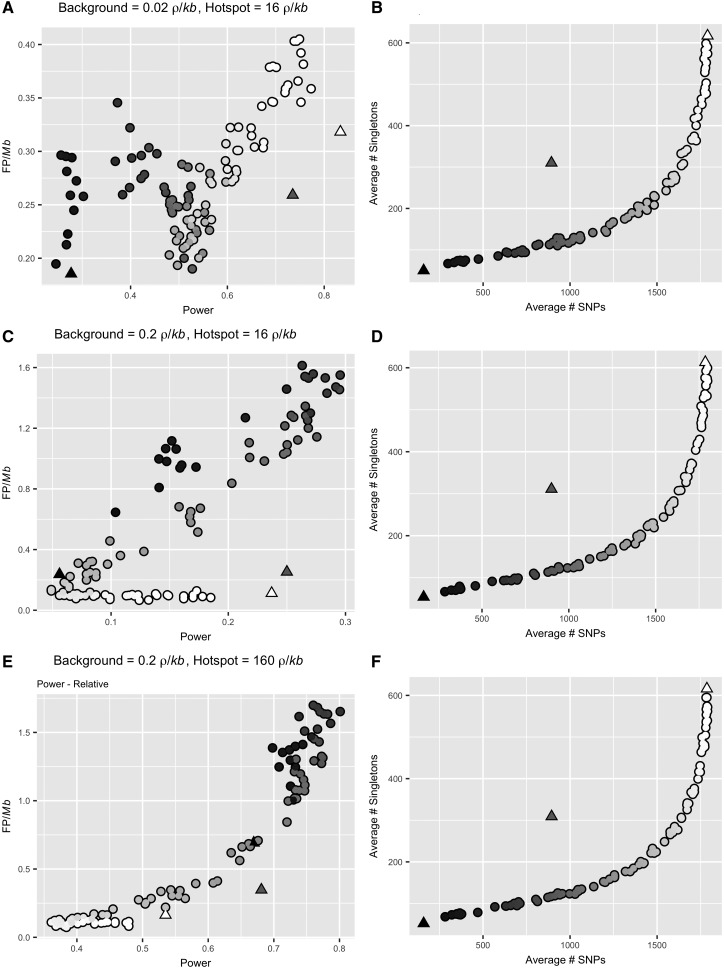
Fig. 5.
The relationship between power and false positive frequency following a population contraction is complex and depends on timing, duration, and background recombination rate. (A, C, E) Each point (circles) on the plot indicates the power (x-axis) and false positive frequency (y-axis) following a population contraction that varies in duration and recovery time. Performance for three control, equilibrium populations (N = 1,000, 5,000, 10,000) are also shown (triangles). The second two rows of plots show the change in performance with the background recombination rate is increased (10×) and the absolute (C) or relative (E) magnitude of the hotspot is held constant. The shading of the points represents the average number of SNPs per simulation, which directly corresponds to the values on the x-axis of (B, D, F). (B, D, F) Following an equilibrium demographic history, there is a constant linear expectation for the relationship between the number of SNPs and the number of singletons (triangles). Population contractions result in the observation of less singletons than expected given the number of SNPs (circles). The relationship between the average number of SNPs and singletons remains constant, as expected, when only the recombination rate is modified (D, F). The shading of the points represents the average number of SNPs per simulation plotted on the x-axis.

