Fig. 6.
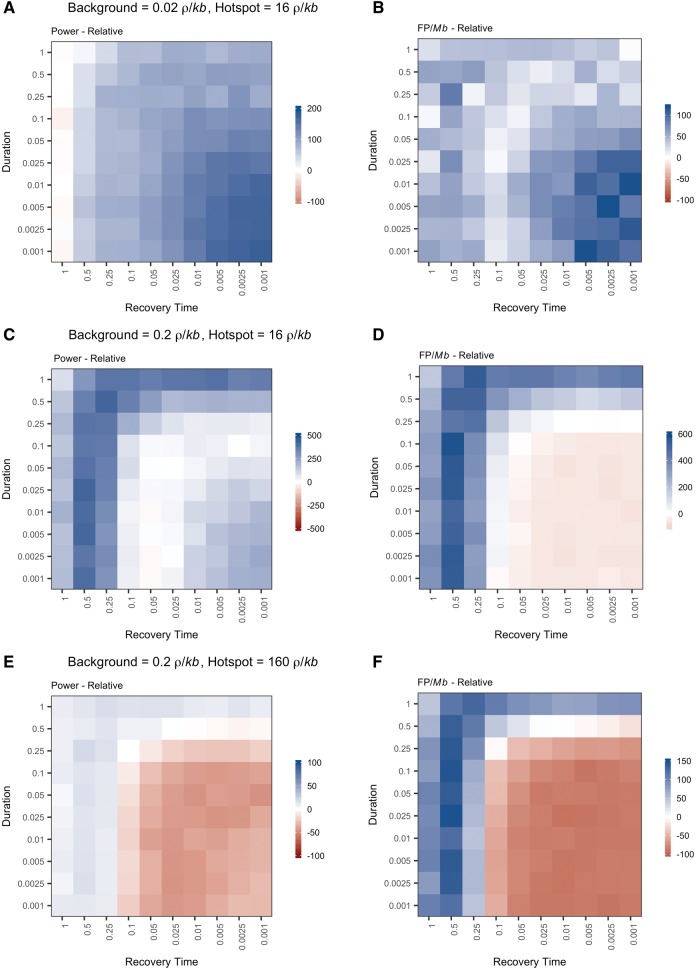
The relationship between demographic history and performance is sensitive to the background recombination rate (A, C, E). Each square in the plot represents the relative power to detect a hotspot for a population with a population expansion of a given duration (y-axis) and recovery time (x-axis) compared with a control equilibrium population of the same ending size (N0 = 1,000). Power was calculated as the percent of measurable simulations for each condition in which the true recombination hotspot was significantly identified by LDhot. The relationship between demographic history and performance changes when the background recombination rate is increased (10×) and the absolute (C) or relative (E) magnitude of the hotspot is held constant. (B, D, F) Each square represents the percent difference in frequency of false positives observed per Mb following a population contraction relative to a control, equilibrium population of the same ending size (N0 = 1,000). The false positive frequency was calculated as the total number of false positives identified per condition divided by the sum of the measurable length per condition. The frequency of false positives following certain demographic histories increased dramatically when the background recombination rate was increased (10×) and the absolute (D) or relative (F) magnitude of the hotspot was held constant.

