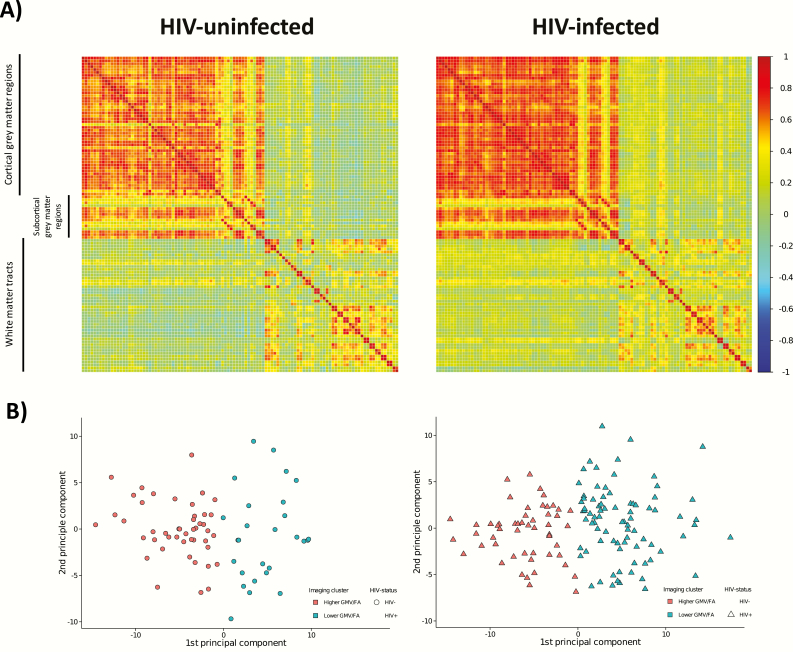
Figure 4.
K-means cluster analysis results by human immunodeficiency virus (HIV) status. A, Visualization of the correlation matrices for the regions of cortical and subcortical gray matter volume (GMV; Harvard-Oxford atlas) and white matter fractional anisotropy (FA) (International Consortium of Brain Mapping DTI-81 white matter labels) used in the k-means clustering analysis for the HIV-infected and HIV-uninfected groups. The correlation coefficient is represented by the color of the box (scale to the right of the figure). B, Principal component plots showing the separation of the clusters based on the k-means clustering analysis of parcellated gray matter and mean FA data for the HIV-uninfected controls on the left (circles) and HIV-infected participants on the right (triangles). Cluster 1 (orange) had higher GMV and higher FA for each region whereas cluster 2 (green) had lower GMV and lower FA for each region. HIV-infected individuals were more likely to be members of the lower GMV and lower FA cluster (odds ratio, 2.74; 95% confidence interval, 1.53–4.98).

