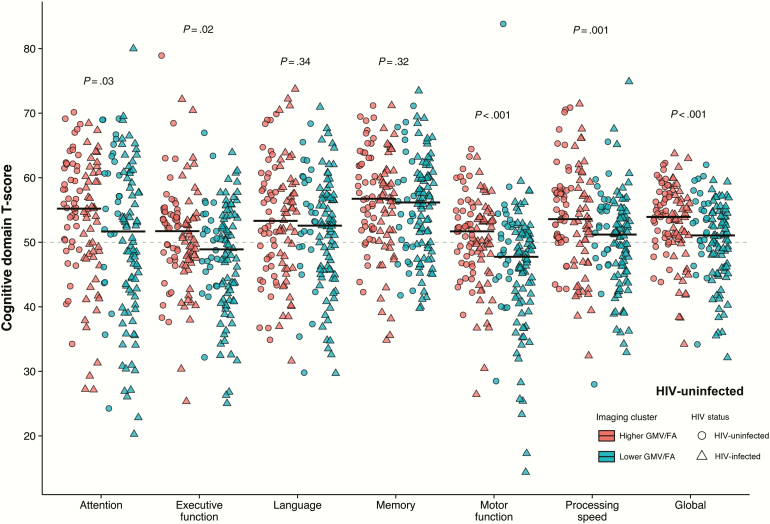
Figure 5.
K-means cluster analysis and cognitive function by human immunodeficiency virus (HIV) status. Jitterplot of cognitive domain T-scores grouped by k-means cluster analysis. Cluster 1 represents the cluster with higher total gray matter volume (GMV) and higher mean white matter skeleton fractional anisotropy (FA) in each region, whereas cluster 2 represents the cluster with lower total GMV and lower mean white matter skeleton FA in each region. Black lines represent medians for each cluster with P values calculated using the Wilcoxon rank-sum test.

