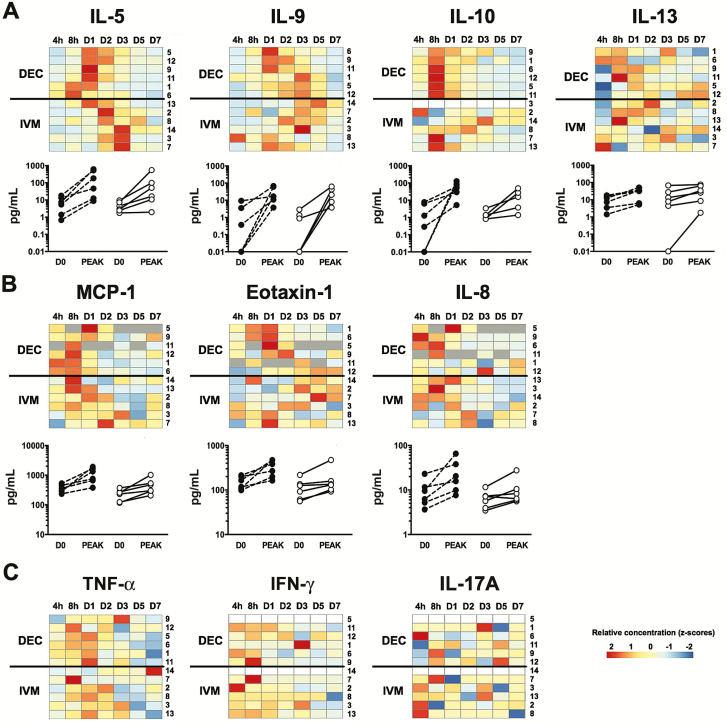
Figure 7.
Serum mediator levels following single-dose administration of diethylcarbamazine (DEC) or ivermectin (IVM). Heat maps represent the range of net values for the first 7 days posttreatment (from low in blue to high in red) measured for interleukin (IL) 5, IL-9, IL-10, IL-13 (A), monocyte chemotactic protein-1 (MCP-1), eotaxin-1, IL-8, Regulated on Activation, Normal T Cell Expressed and Secreted (RANTES) (B), and tumor necrosis factor alpha (TNF-α), interferon gamma (IFN-γ), and IL-17A (C). Subjects have been clustered separately for the 2 treatment groups with subject number shown along the right side of the heat map. A gray square indicates a missing value. Individual values measured at baseline (D0) and at peak are represented below the heat maps for mediators showing a clear expression pattern (DEC group, black circle, IVM group, white circle).

