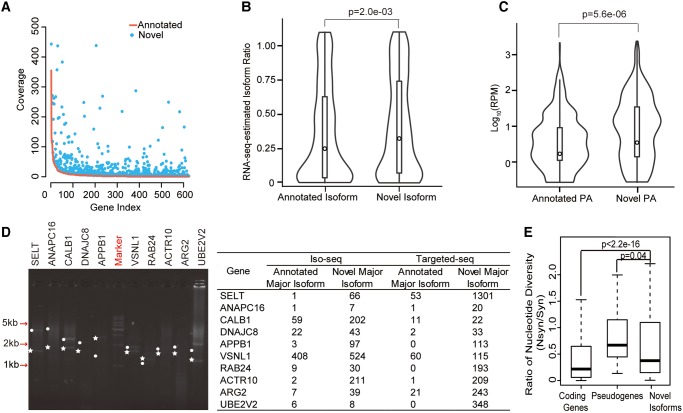
Fig. 4.
Validation of newly identified major novel isoforms. (A) 624 major isoforms annotated by RefSeq. Red curve, coverage of these isoforms from the PacBio Iso-seq data; blue points, coverage of 1,119 newly identified isoforms from the PacBio Iso-seq data. (B, C) Violin plots of the proportions of the newly identified isoforms, as well as the major isoforms as annotated by RefSeq. The proportions of isoforms were estimated on the basis of the inclusion ratio of alternative splicing events (B), or the sequencing coverage of PA sites (C). P values were calculated on the basis of the Wilcoxon signed-rank test. (D) Left: example of agarose electrophoresis showing ten newly identified major isoforms (dots) and ten RefSeq-annotated major isoforms (stars). Right: the coverage of these isoforms in the initial genome-wide Iso-seq and the targeted PacBio sequencing are summarized in the table. (E) The ratio of nucleotide diversity between nonsynonymous (Nsyn) sites and synonymous (Syn) sites. The ratios were calculated and shown for human annotated coding genes (Coding Genes), pseudogenes (Pseudogenes), as well as coding regions unique to novel isoforms (Novel Isoforms), as indicated.

