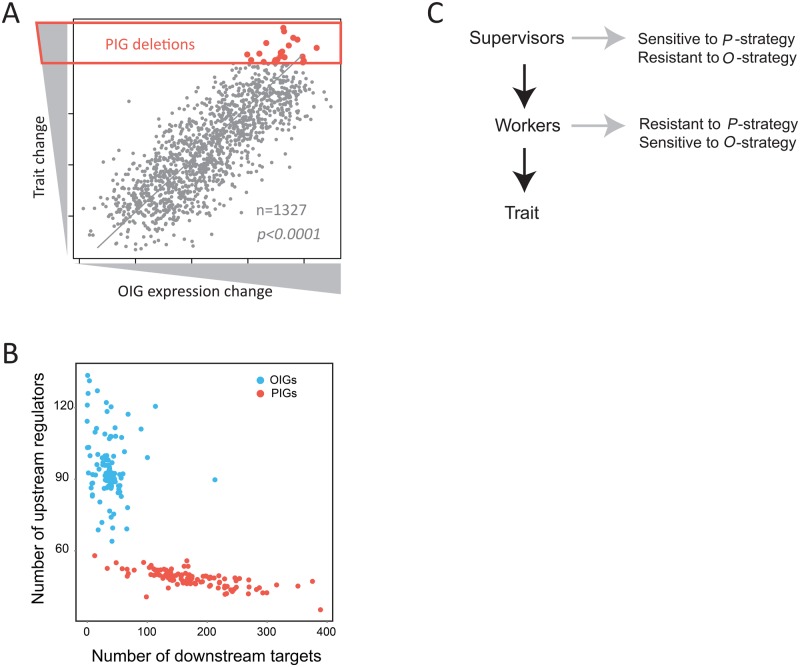
Fig. 2.
Characteristics of PIGs and OIGs suggest a supervisor–worker gene architecture. (A) A schematic diagram shows how OIGs are characterized because of their strong expression changes in mutants lacking a PIG, explaining why OIGs are overall regulated by PIGs of the same trait. (B) Distinct properties of PIGs and OIGs in the gene regulatory network. The numbers of downstream targets and upstream regulator per OIG (or PIG) are shown. Each dot represents a trait, and the average of all OIGs (or PIGs) of a trait is presented. The same 108 traits as in figure 1 are examined. Gene A is called the downstream target of gene B and B the upstream regulator of A if gene A shows a significant expression change (P < 0.0001) in the mutant lacking gene B. (C) The proposed supervisor–worker gene architecture.

