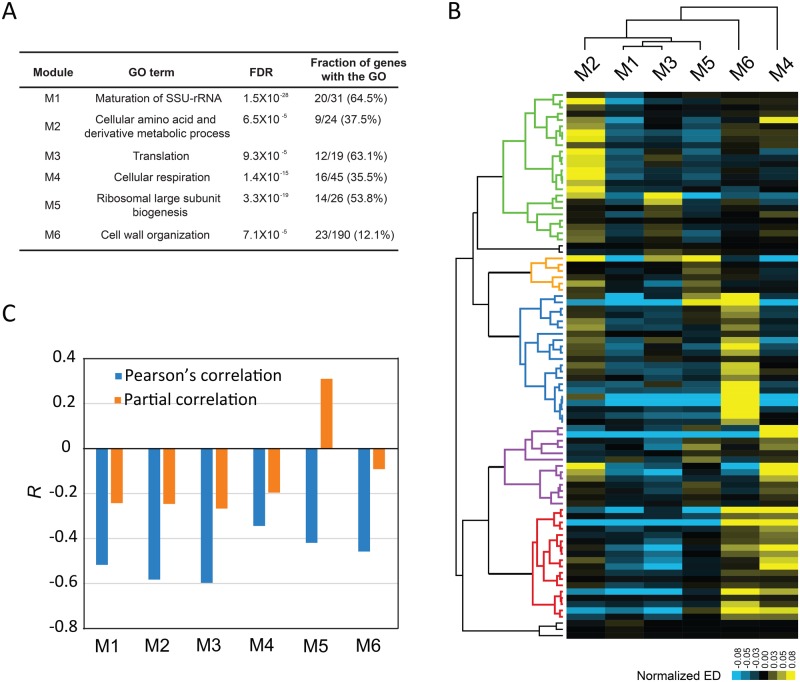
Fig. 3.
Unique mechanistic insights provided by observed workers. (A) Details of the six worker modules underlying the yeast cell growth. (B) Five major types of cell growth reduction, marked by different colors in the dendrogram, are revealed by examining the activity of the worker modules. Each row represents a slow-growth mutant, and the expression distance (ED) of a module is normalized by subtracting the average ED of the six modules in the mutant. (C) The Pearson’s R between cell growth rate and the ED of each individual module, in comparison to that of the partial correlation that controls for the other five modules.

