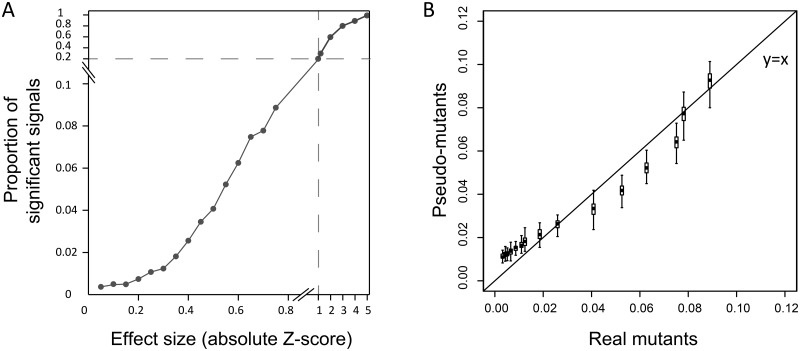
Fig. 8.
Statistically insignificant signals can be well explained by false negatives of P-strategy. (A) The proportion of observing significant differences between 50 mutant cells and 50 wild-type cells is a function of the effect sizes of mutants. (B) The proportion of significant signals of real gene deletion mutants is similar to that of the simulated pseudomutants that have genuine differences from the wild-type, suggesting that the remaining insignificant signals be well explained by false negatives of the P-strategy. We considered only the effect sizes of Z = 0–0.77, which cover 50% of the data with Z > 0 in a standard Gaussian distribution. The box and error bar encompass 50% and 90% of the data derived from 100 replicates, respectively.

