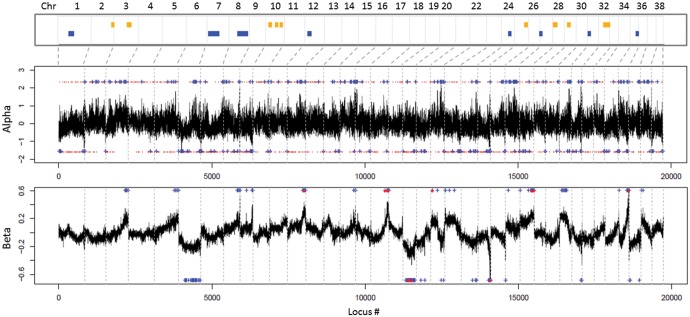
Fig. 5.
Distribution of the introgressed regions along the genomes of admixed individuals. Top: PCAdmix outlier regions. Blue bars indicate regions with excess of wolf-derived alleles, yellow bars indicate excess of dog-derived alleles. Center: BGC (Bayesian Genomic Cline analysis; Gompert and Buerkle 2012) alpha parameter outlier SNPs. Values higher than 0 indicate excess of dog alleles, values lower than 0 indicate excess of wolf alleles. Bottom: outlier SNPs for the BGC beta parameter. Values higher than 0 indicate resistance to introgression, lower than 0 an excess of introgression, compared to random expectations. In both cases, BGC significant outliers are indicated by blue crosses (top or bottom 1% of the empirical distribution of values) and by red dots (95% credibility intervals of 10,000 iterations not including 0).

