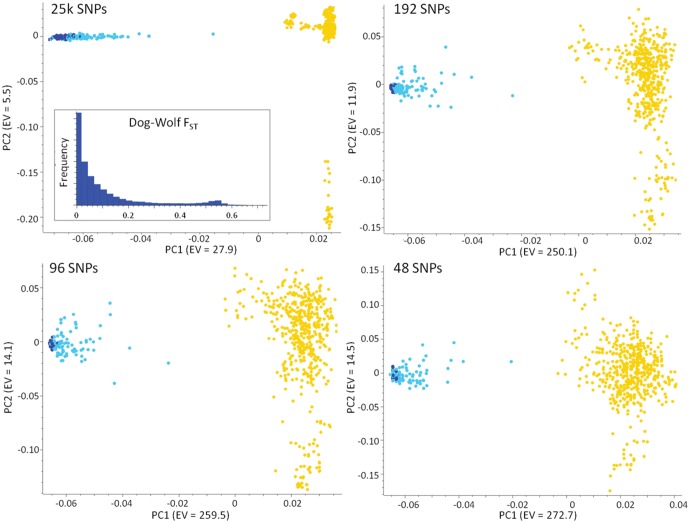
Fig. 6.
Principal component analysis (PCA) computed in SVS on the 25 k SNP data set and on the 192, 96, 48 SNPs with the highest wolf-dog FST values. For each data set, PC1 versus PC2 are indicated (axes are not to scale), and the overall FST distribution for the 25 k data set is represented in the histogram. Yellow dots indicate dogs, blue dots nonadmixed wolves, light blue dots admixed wolves (Admixtureqw < 0.999). The power of the top 48 SNPs is comparable to that of the 25 k data set, indicating that they can be used as reliable ancestry-informative-markers (AIMs), although no clear subdivision could be traced between some of the admixed and the nonadmixed wolves.

