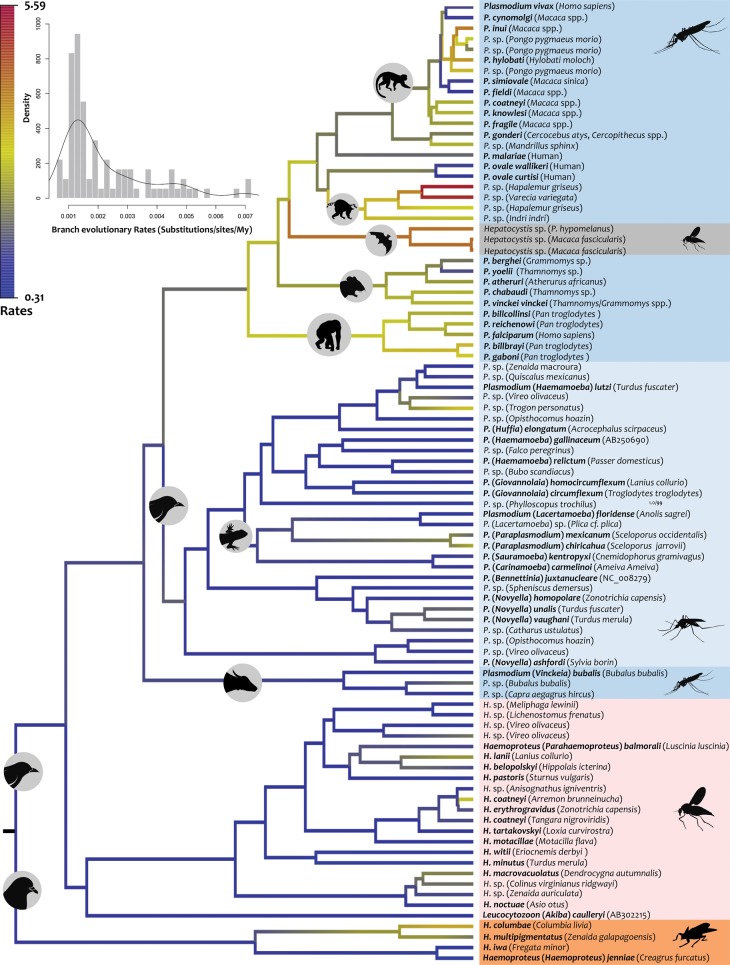
Fig. 3.
Relative evolutionary rates of haemosporidian parasites. Branches are colored from high (red) to low (blue) according to their relative rates respect to the root rate (that is set to one) estimated from RelTime without calibration constraints. The histogram shows branch absolute evolutionary rates (substitutions/site/My) estimated with respect to the root rate under calibration scenario 1. Differences in vectors are indicated using a color code.

