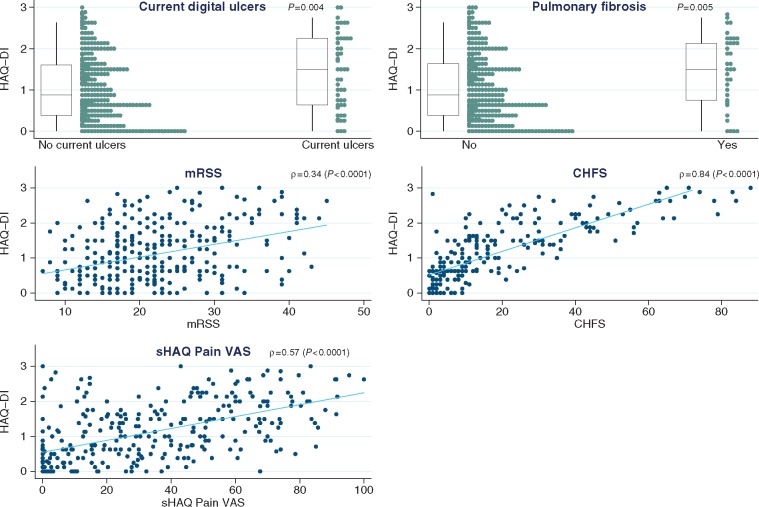
Fig. 3.
Associates of HAQ disability index
For the relation between HAQ-DI and binary variables (here current digital ulcers and pulmonary fibrosis), box plots (with median and interquartile ranges) summarize the distribution of the index within each level of the binary variable. In addition, a strip plot shown next to each box plot gives more detail on the dispersion of all individual points. For the relation between HAQ-DI and continuous variables (here mRSS, CHFS and sHAQ Pain VAS), a scatter plot is shown for each pair and superimposed with a linear regression line to describe the correlation direction. CHFS: Cochin Hand Function Scale; mRSS: modified Rodnan skin score; sHAQ: Scleroderma HAQ.

