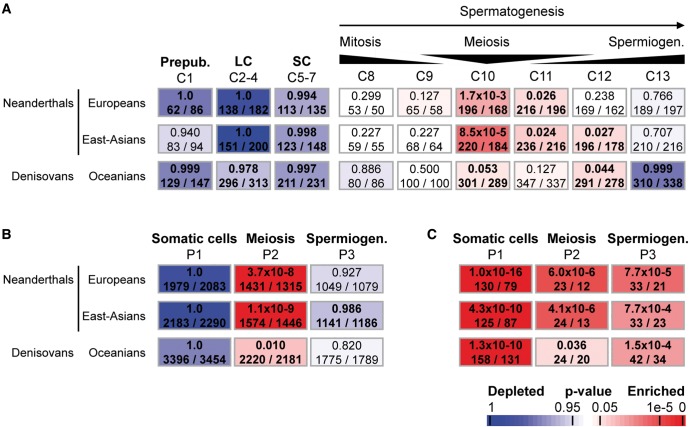
Fig. 1.
Enrichment of meiotic expression genes in regions deficient in Neanderthal and Denisovan ancestries using the Fisher’s exact probability (Gaussian hypergeometric test). (A) Chalmel et al. defined a set of 13 expression clusters (termed C1–13) associated with peak expression in the different testicular cell types (top row) (Chalmel et al. 2012). Clusters C1–C7 correspond to genes expressed in somatic testicular cells including prepubertal somatic cells (C1), steroidogenic Leydig cells (LC, C2–4), and Sertoli cells (SC, C5–7). Clusters C8–C13 are gradually associated with loci preferentially expressed in germ cells: the mitotic spermatogonia (C8 and C9), meiotic spermatocytes (C10), and postmeiotic haploid spermatids (C13). (B and C) Analysis of the transcriptional landscape of testicular cell populations yields three broad expression patterns associated with peak expression in somatic cells (P1), meiotic spermatocytes (P2) and postmeiotic spermatids (P3) (top row). Enrichment of autosomal (A and B) and X-linked (C) genes belonging to each cluster is evaluated for each region deficient in NA and DA by calculating the Fisher’s exact probability (Gaussian hypergeometric test). (A–C) Results are given for the Neanderthal introgression map inferred from the genomes of present-day European and east-Asian (from 1,000 Genomes project) individuals and for the Denisovan introgression map in the genome of present-day Oceanian individuals (Simons Genome Diversity Project, SGDP). The names of expression cluster are indicated on top of each column. Associated P-values as well as numbers of genes as observed and expected by chance are given within rectangles that are color-coded with red and blue indicating over- and under-representation, respectively, according to the scale bar on bottom. Numbers in bold indicate significant over-representation.

