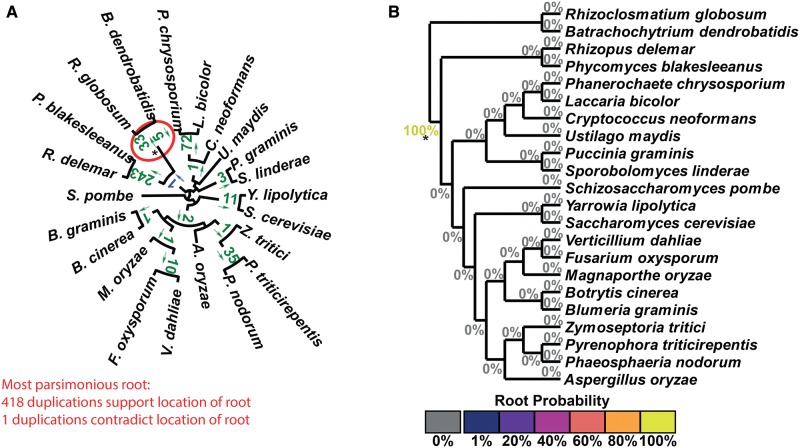
Fig. 4.
STRIDE analysis applied the set of fungi gene trees. (A) Numbers of identified gene duplication events are marked on the branches they are observed on and arrows indicate the direction in which the duplication occurred. Gene duplication events are in agreement with the maximum parsimony root of the tree if the arrow points away from the root, and are in green. Those that disagree are in blue. The maximum parsimony root is circled in red and is in agreement with the correct root, marked with a *. (B) The probabilities for the location of the root calculated by STRIDE.

