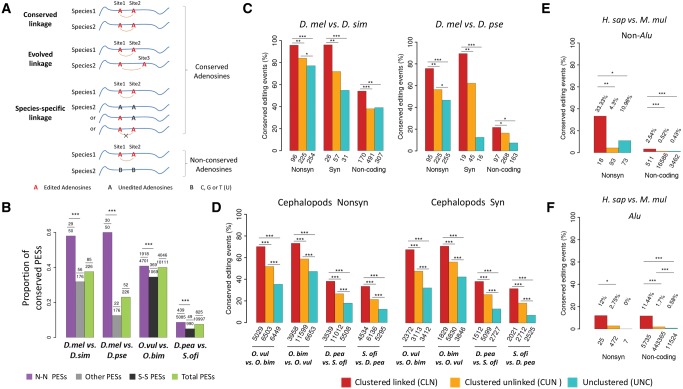
Fig. 2.
Conservation of linked editing events between species. (A) The possible conservation patterns of a slPES in another species: 1) conserved linkage, for which the two orthologous adenosine sites are both edited and significantly linked in another species; 2) evolved linkage, for which one of the orthologous adenosine sites is edited but linked with a different editing site; 3) species-specific linkage, for which the two orthologous sites might be edited but do not show linkage to each other, and they are not linked with other editing sites as well. It is also possible that the orthologous sites in another species are not adenosines (B, which represents C, T, or G) so that editing would not occur on the orthologous sites. (B) The proportion (y-axis) of the total, the N–N, and the remaining slPESs that are conserved between two Drosophila species or between two cephalopod species (***P < 0.001; Fisher’s exact tests). In each comparison, the numbers of the tested slPESs and the conserved slPESs between species are given above the plot. In flies, all the remaining (Other) slPESs were used to compare with the N–N slPESs to increase the statistical power; and in cephalopods, the S–S (synonymous–synonymous) slPESs were used to compare with the N–N slPESs. (C–F) The proportions of the editing events that are evolutionarily conserved between two species of Drosophila (brains, C), cephalopods (pooled tissues, D), non-Alu (E) and Alu (F) regions between humans and rhesus macaque (prefrontal cortex and cerebellum). Nonsynonymous (Nonsyn), synonymous (Syn) and noncoding adenosine sites are divided into three categories: 1) clustered (within 100 nt) and significantly linked (CLN); 2) clustered but unlinked (CUN); and 3) unclustered (UNC). When comparing editing events in two species, only the sites with editing level ≥ 0.05 and the genomic DNA were adenosines in both species were considered. The numbers of total editing sites in each category used for comparison are presented below the bars. The Fisher’s exact tests were performed to detect statistical significance (*P < 0.05; **P < 0.01; ***P < 0.001).

