
Fig. 2.
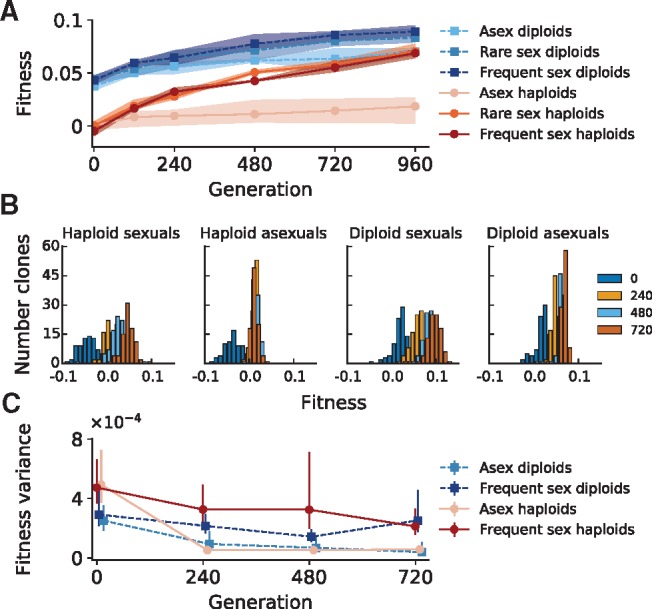
(A) Mean fitness through time of three replicate populations for each recombination rate and ploidy. Shading represents total range of fitnesses observed for each treatment and timepoint. Note that fitness measurements represent the average additional progeny per generation of the tested population when compared with the reference strain. (B) Distribution of fitness through time within an asexual haploid, sexual haploid, asexual diploid, and sexual diploid population. Legend denotes timepoint of sampling. (C) Within-population variance in fitness as a function of time in an asexual haploid, sexual haploid, asexual diploid and sexual diploid population, calculated from clone fitness data (96 clones per timepoint). Error bars are bootstrapped 95% confidence intervals.