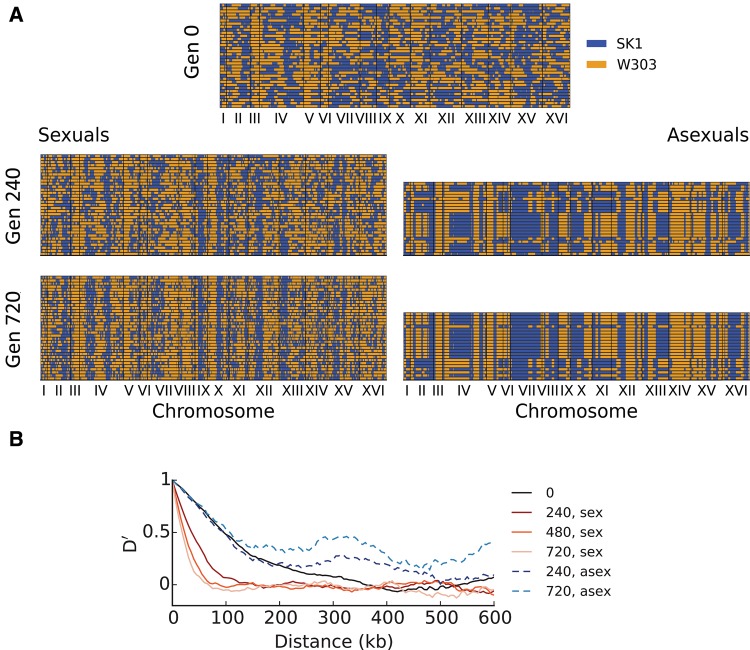
Fig. 5.
(A) Genotypes of sequenced haploid clones from the initial founder population at generation 0 (top) and at generations 240 and 720 from evolved sexual lines (left) and from evolved asexual lines (right). Each row denotes the genotype of a sequenced clone, with regions colored in blue denoting loci with the SK1 allele, and regions colored in orange denoting loci with the W303 allele. We sequenced 36 and 24 clones per timepoint for sexual and asexual populations, respectively. (B) Normalized, average linkage disequilibrium D′ (Lewontin 1964) calculated from clone sequences, as a function of distance from the focal site (Materials and Methods). Note that D′ declines over distance and time for sexual populations, whereas increasing over time for asexual populations, reflecting the fixation of individual clones.

