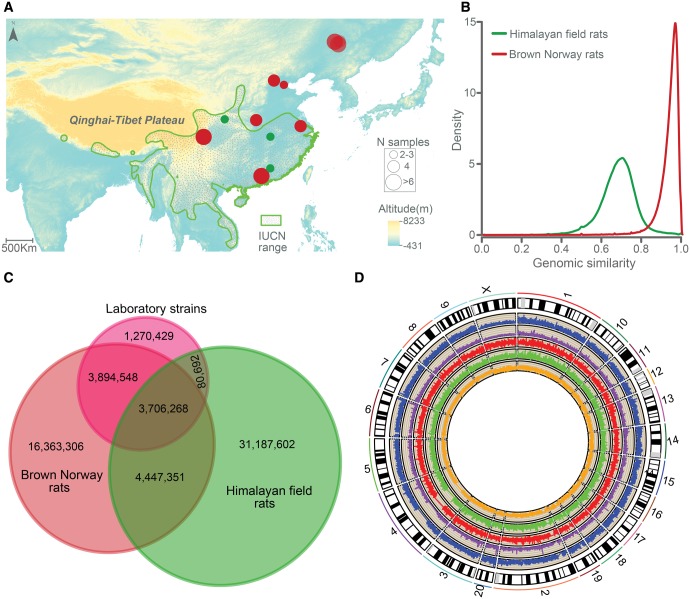
Fig. 1.
Genomic variation in Brown Norway and Himalayan field rats. (A) Geographical distribution of Brown Norway (red circle) and Himalayan field (green circle) rats used in this study. The colored areas in green indicate the geographic range of Himalayan field rats based on IUCN distribution (Aplin, et al. 2008). (B) Genomic similarity of Brown Norway and Himalayan field rats to the RGSC 5.0 reference genome. (C) The number of SNPs unique to and shared by Himalayan field, Brown Norway and laboratory rat strains. (D) Genome-wide distribution of nucleotide diversity, Tajima’s D value and recombination rate in the Brown Norway and Himalayan field rats. The two circles adjacent to the karyotypes show lines representing nucleotide diversity in the Brown Norway (purple) and Himalayan field (blue) rat. The innermost circle shows lines representing local recombination rate (cM/Mb) for the Brown Norway rats (orange). The next two circles show lines representing Tajima’s D value in the Brown Norway (green) and Himalayan field rats (red).

