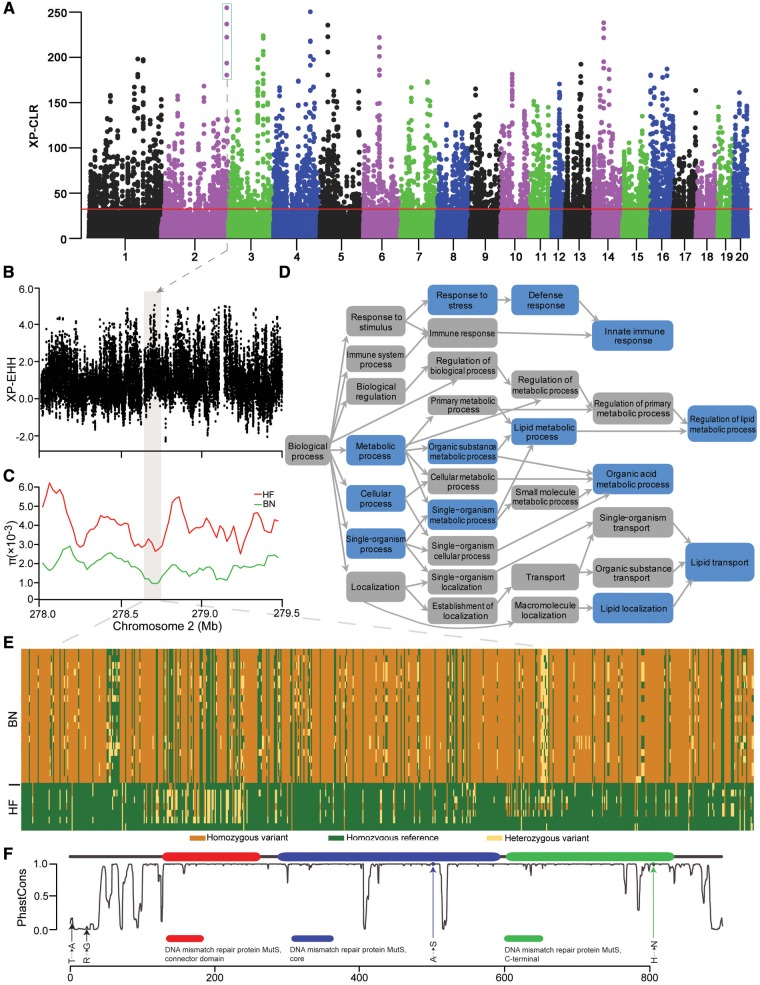
Fig. 5.
Genomic regions with selective sweep signals in the Brown Norway (BN) rat. (A) Distribution of cross-population composite likelihood ratio (XP-CLR) for 100 kb windows with 20 kb steps. Red horizontal line corresponds to FDR 5% significance level threshold. (B) Score of standardized cross-population extended haplotype homozygosity (XP-EHH) for each SNP along chromosome 2. (C) Nucleotide diversity (π) values of Himalayan field (HF) and BN rat are plotted using a 100-kb sliding window. The box shaded in grey in (B, C) represents the strongest signals of XP-CLR on chromosome 2. (D) Functional enrichment of genes covered in the sweep regions. Blue shading indicates significantly enriched categories in the BN rat lineage. (E) Genotypes of SNPs in putative selective sweeps containing the Msh4 gene in the BN and HF rats. (F) The distribution of fixed nonsynonymous BN rat mutations (arrows) compared with the HF rat. The gray curve shows the amino acid conservation scores; higher scores indicate higher conservation across 13 vertebrate species. The x axis shows the amino acid position from the N-terminal.

